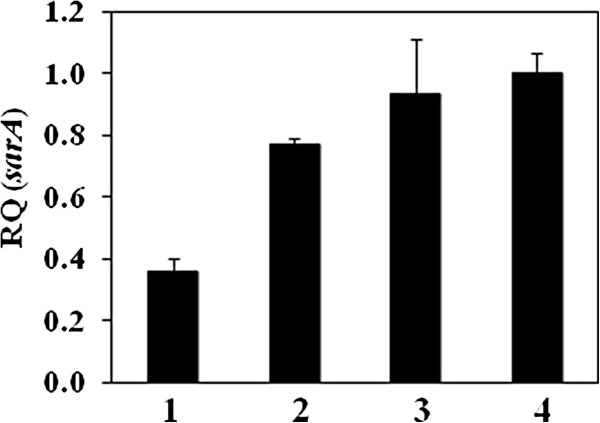
Figure 6.

Transcriptional levels of sarA determined by using ΔΔCT comparative method. (1) USA400-related isolates 08–008 (agr-dysfunctional) and (2) 96/05 (agr-functional). (3) BMB9393 was used as a control and (4) RN6390B as calibrator. RQ: Relative quantity.
