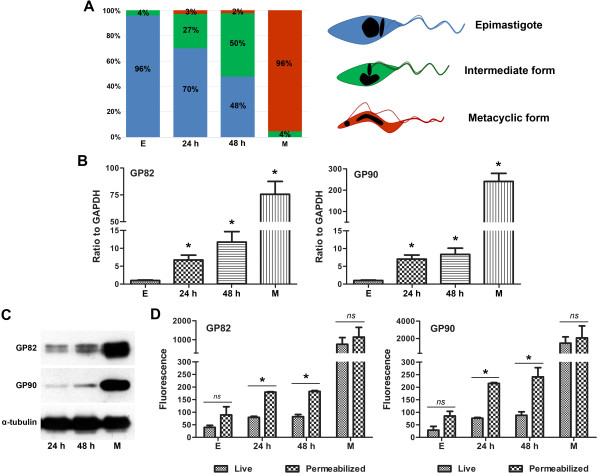
Figure 1.
Expression of GP82 and GP90 at different time-points during T. cruzi metacyclogenesis. (A) Relative number of epimastigotes (blue), intermediate forms (green) and metacyclic trypomastigotes (red) in analyzed samples. Numbers are derived from three independent experiments where 200 cells were analyzed. A representative drawing of each parasite form is shown on the right. (B) Quantitative real-time PCR for determination of transcript levels. Means and standard deviations are derived from three independent experiments. The difference between epimastigotes and other forms was significant (P <0.05). (C) SDS-PAGE followed by Western blot showing the presence of GP82 and GP90 at 24 and 48 h. Total protein extract from 2.5 × 10⁶ parasites were used and anti-α-tubulin mAb was used as loading control. Experiments shown were carried out three times with similar results. (D) Live or permeabilized parasites were reacted with mAb 3F6 or 1G7 and processed for flow cytometry analysis. Values represent fluorescence means and standard deviation of independent experiments that were normalized by the fluorescence of parasites incubated only with secondary antibody. The difference between live and permeabilized parasites was significant for 24 and 48 h samples (P <0.05) and not significant (ns) for epimastigotes and metacyclic forms.

