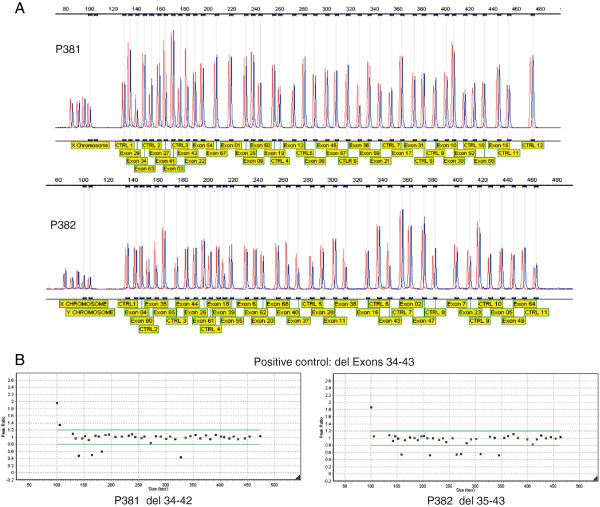
Figure 1.
Validation of the MLPA probe sets. In addition to 50 normal DNAs the probe sets were used to analyze a positive control with a deletion of exons 32–43. The top two panels (A) show the difference in peak height between a normal control (red) and the positive control (blue) for both MLPA kits. The size and target of each product is also indicated. This data is also represented in the bottom two panels (B), where blue squares represent control amplicons, green squares are probes for COL11A1 that fall within peak ratios of 1.2 -0.8 of a normalised control. Red squares fall above or below peak ratios of 0.8, indicating a duplicated or deleted region. The probes for the X and Y chromosomes (far left) may differ depending upon the gender of the DNA control. Probes for COL11A1 exons 32 and 33, which are known to be within the deleted region, are not included in either kit.

