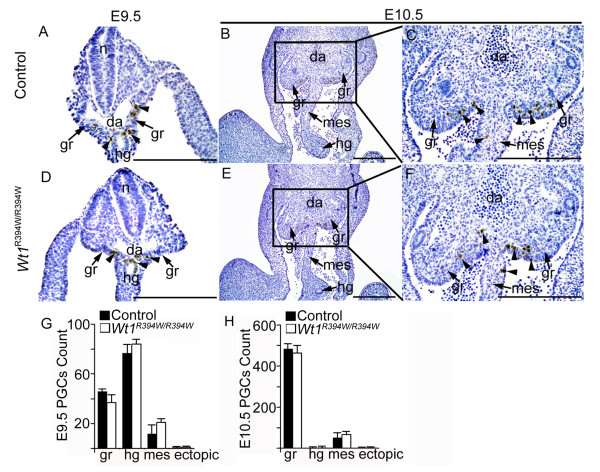
Figure 4.
PGC migration was normal in GR-deficient embryos. Transverse sections of control (A-C) and Wt1R394W/R394W embryos (D-F) were prepared and PGCs (black arrow-heads) were labeled with Stella (brown signal) (A-F). The PGC migration process was assessed by counting the number of PGCs at different locations along the migrating pathway at E9.5 (G) and E10.5 (H). At E9.5, most of the PGCs were observed in the hindgut and mesentery of both control (A) and Wt1R394W/R394W (D) embryos. At E10.5, most of the PGCs had reached the GR, and very few PGCs remained in the mesentery (B, C, E, F). Histogram summarizing selected PGCs number in cross sections of three independent embryos and no difference was noted between control and Wt1R394W/R394W embryos (G, H). n, neural tube; da, dorsal artery; gr, genital ridge; hg, hindgut; mes, mesentery. Scale bars: 50 μm.

