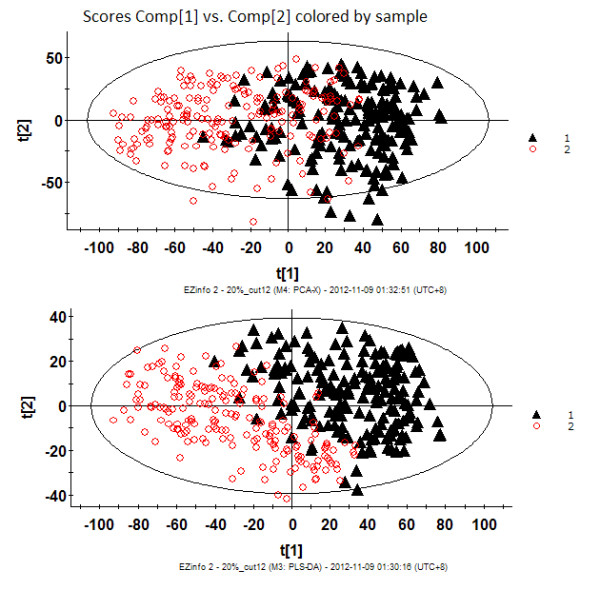
Figure 2.

Urinary metabolic-profiling analysis of rats in the low-calcium group (LCG) and normal-calcium group (NCG) during weeks 1 to 12. (A) Principal component analysis (PCA) score plots; (B) partial least-squares discriminant analysis (PLS-DA) score plots. LCG rats are indicated by black triangles and NCG rats by red circles. Each data point represents one subject. Comp, component. t[1], component 1; t[2], component 2.
