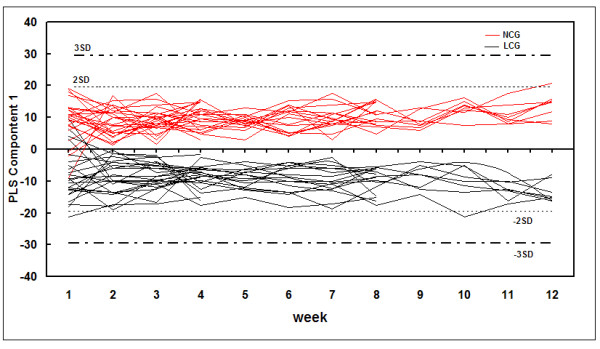
Figure 3.

Batch partial least-squares (PLS) scores plots of urine samples mapped with time. Dashed horizontal lines show two and three standard deviations (SDs) for the dataset. Low-calcium group (LCG) rats are indicated by black lines and normal-calcium group (NCG) rats by red lines.
