Figure 4.
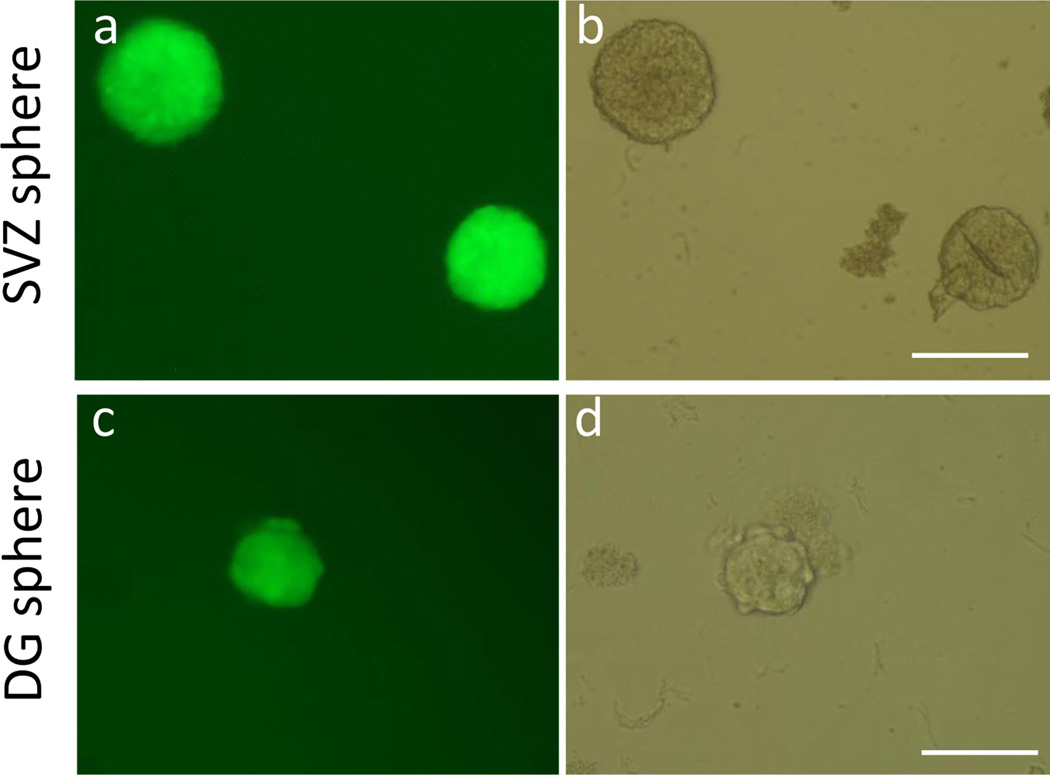
Representative images of neurospheres. (a) A fluorescent image and (b) a phase contrast image of SVZ neurospheres appeared at 7 days after initial plating (passage 0). (c) A fluorescent image and (d) a phase contrast image of a DG neurosphere appeared at 14 days after first plating (passage 0). Scale bar = 200 µm.

