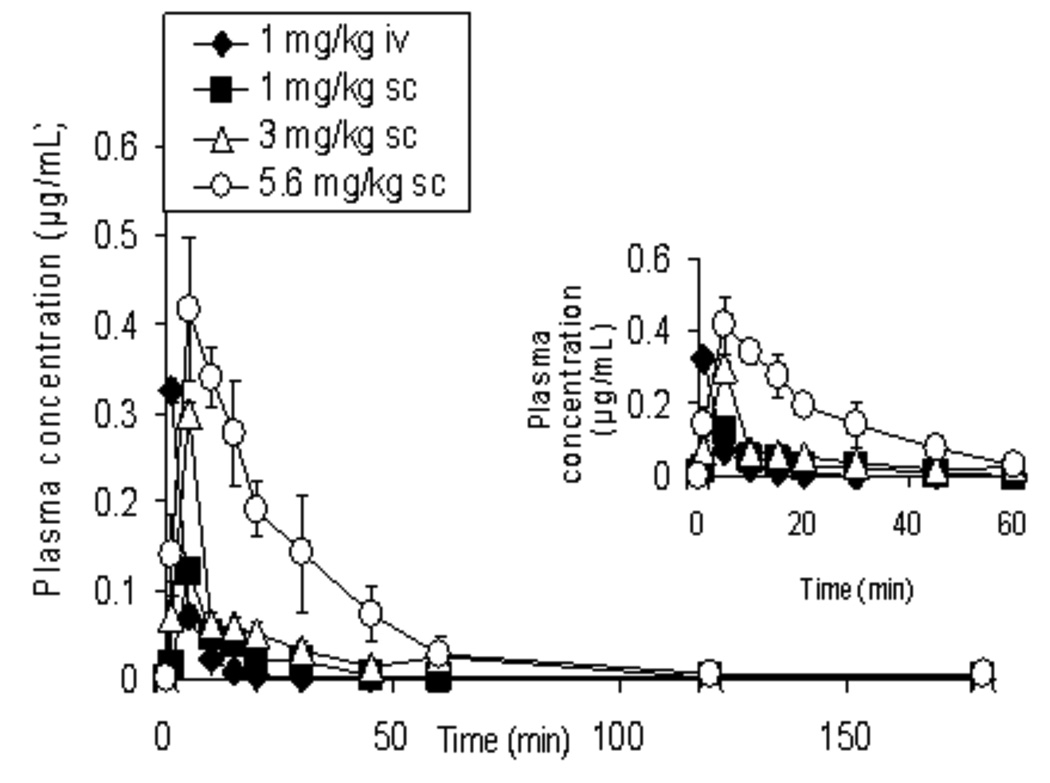
FIG. 4.
Plasma concentration-time (AUC0–180) curves of bPiDDB in rats after intravenous (1 mg/kg) and subcutaneous administration (1, 3, 5.6 mg/kg) of [14CH3]-bPiDDB (n = 4–5). The curves in the inset represents AUC0–60 of bPiDDB in rats after intravenous (1 mg/kg) and subcutaneous administration (1, 3, 5.6 mg/kg) of bPiDDB (n = 4–5). The analysis was carried out by β- scintillation spectrometry. All values show the mean ± SEM.

