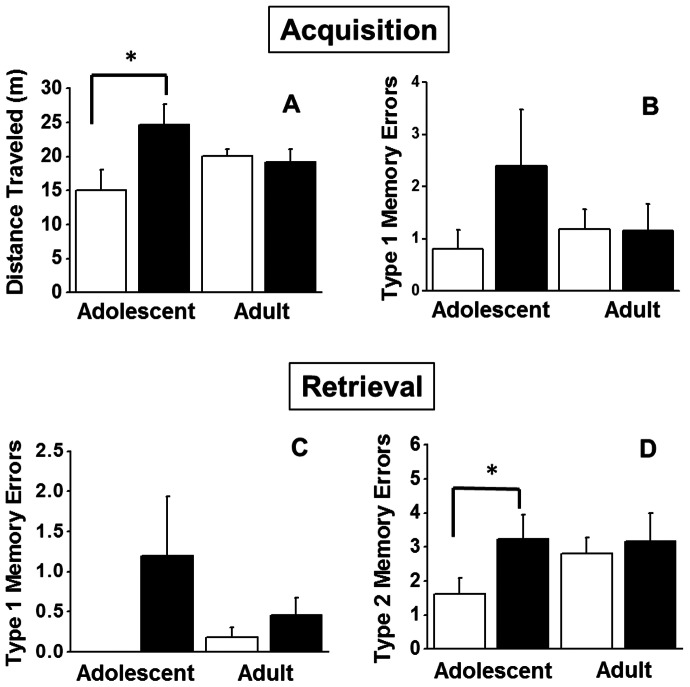
Figure 5. Effect of acute ethanol following chronic intermittent ethanol (black bars) or saline (white bars) exposure during adolescence or adulthood.
Panel A and B represent distance traveled and type1 working memory errors, respectively, 30 m after administration of 1.5 g/kg EtOH i.p. during the acquisition phase of DNMTP. Bottom panels C and D represent type1 and type2 working memory errors, respectively, 90 m after administration of 1.5 g/kg EtOH i.p. during the retrieval phase of DNMTP. Data are expressed as group means + SEM (n = 5 adolescent saline, n = 5 adolescent CIE, n = 5 young adult saline, n = 7 young adult CIE, n = 6 adult saline, n = 6 adult CIE). Asterisks denote a significant difference between the animals pre-treated with ethanol vs. saline during adolescence (All Post-hoc t-tests, p<0.05).

