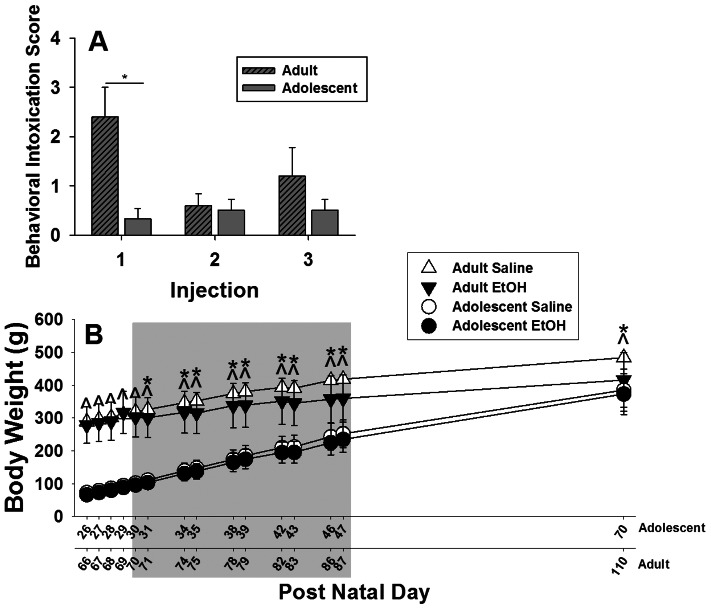
Figure 6. Behavioral intoxication scores after the first three CIE EtOH administrations (panel A) and body weights before, during and after CIE (panel B).
Data are expressed as group mean ± SEM. For the behavioral intoxication score, the asterisk denotes a significant effect of age (adolescent vs. adult independent of CIE exposure) on a specific day (Post-hoc t-test with a Šidák adjustment for multiple comparisons, p<0.05). For the body weights, carats denote a significant effect of age at treatment (adult-treated vs. adolescent-treated independent of CIE exposure). Asterisks denote a significant effect of CIE exposure (ethanol vs. saline) in only adult CIE-exposed rats on a specific day (Post-hoc t-test with a Šidák adjustment for multiple comparisons, p<0.05). There were no significant differences in body weights between CIE- and saline-exposed adolescent rats.

