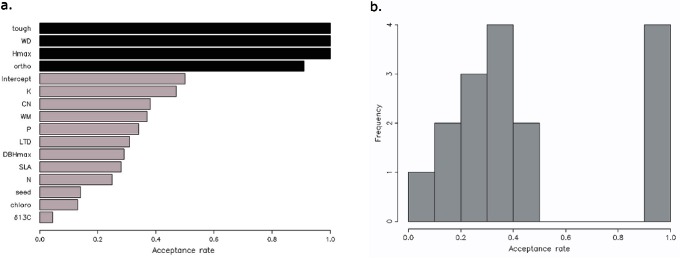
Figure 4. Results of the Kuo-Mallick algorithm for parameter selection.

a: Mean of the distribution for each variable; variables are included in the final model if the mean value exceeds 90%. Variables included in the final models are: stem and branch orientation ( ), maximum height (
 ), wood density (
 ) and laminar toughness (
 ). b: Histogram of the results of the Kuo-Mallick algorithm for parameter selection. Acceptance rates showed a gap from 0.5 to 0.9, and variables with results above 0.9 were selected for the final model.
