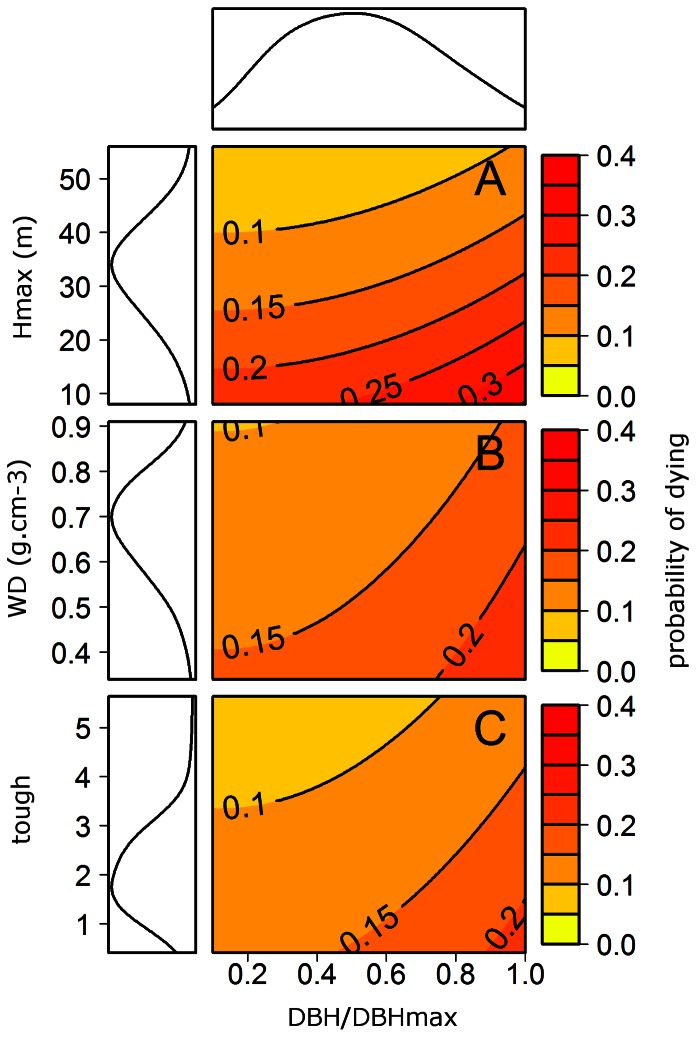
Figure 6. The probability of dying depends on the individual ontogenetic stage and on tree functional traits: the maximum height, Hmax; the wood density, WD; and the laminar toughness, tough.
Simulation of the probability of dying versus the ontogenetic stage ( ) of the tree, with variation of the three continuous functional traits selected in the final model: A the maximum height, B the wood density and C the laminar toughness. Marginal densities are plotted for each trait and for
  , with a bandwidth equal to 10% of the amplitude. Density for laminar toughness (C) shows that maximal values (above 3) are rare; variation of mortality due to this trait is not as strong as the variation due to the maximal height.

