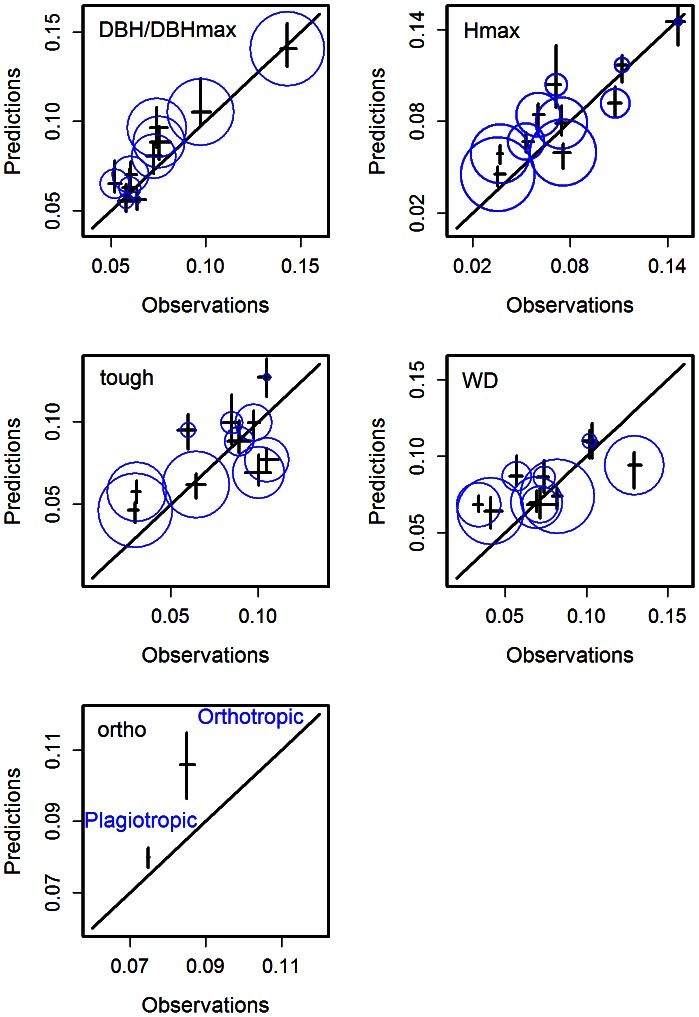
Figure 7. Model validation: the model was calibrated using data from 1992 to 2001 and applied to a validation data set (2001–2010).
For each covariate of the mortality model, we binned individuals into ten bins of equal size, corresponding to the deciles of the covariate distribution. Mortality rates were then computed for each bin using the validation data set (2001–2010). Predictions were plotted against observed rates. Moreover, the size of the blue circle is proportional to the value of the median of each bin.

