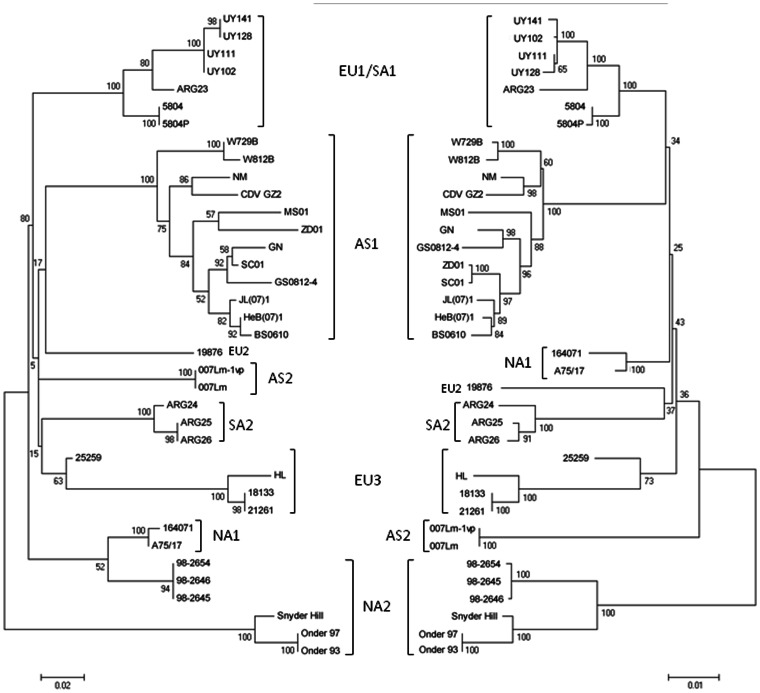
Figure 1. Phylogenetic analysis of CDV isolates.
Thirty-seven nucleotide sequences of the Fsp (left) and H (right) datasets were used. Maximum likelihood trees were constructed using the Hasegawa-Kishino-Yano (G) substitution model for both datasets and were inferred through 500 replicates. Branch lengths are measured in the number of substitutions per site, as shown by the scale bars. Unrooted trees were depicted facing each other for comparison. AS1, Asia 1; AS2, Asia 2; EU1/SA1, Europe 1/South America 1; EU2, Europe 2; EU3, Europe 3; NA1, North America 1; NA2, North America 2; SA2, South America 2; Onder, Onderstepoort strain; Snyder, Snyder-Hill strain.

