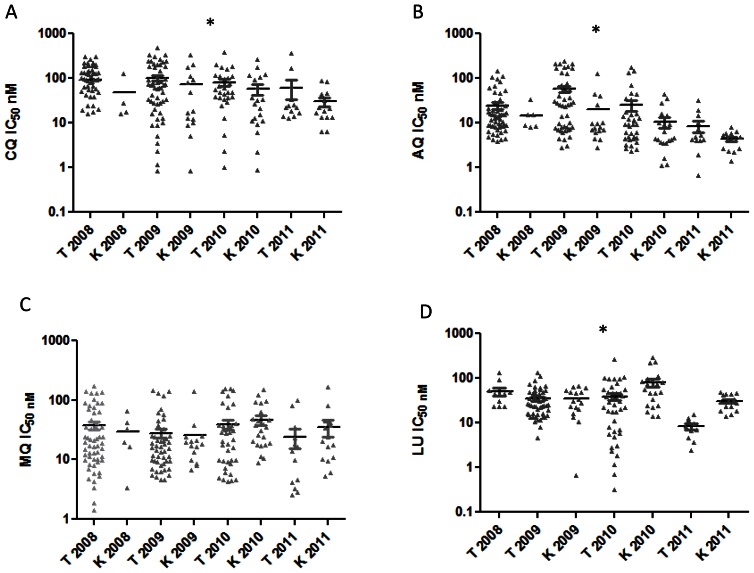
Figure 1. Pfcrt K76T SNP compared against drug IC50 (in nM).
A. Comparison of Pfcrt K76T SNP against CQ IC50 stratified by year; B. Comparison of Pfcrt K76T SNP against AQ IC50 stratified by year; C. Comparison of Pfcrt K76T SNP against MQ IC50 stratified by year; D. Comparison of Pfcrt K76T SNP against LU IC50 stratified by year. Median values are shown. *indicates data is significant.

