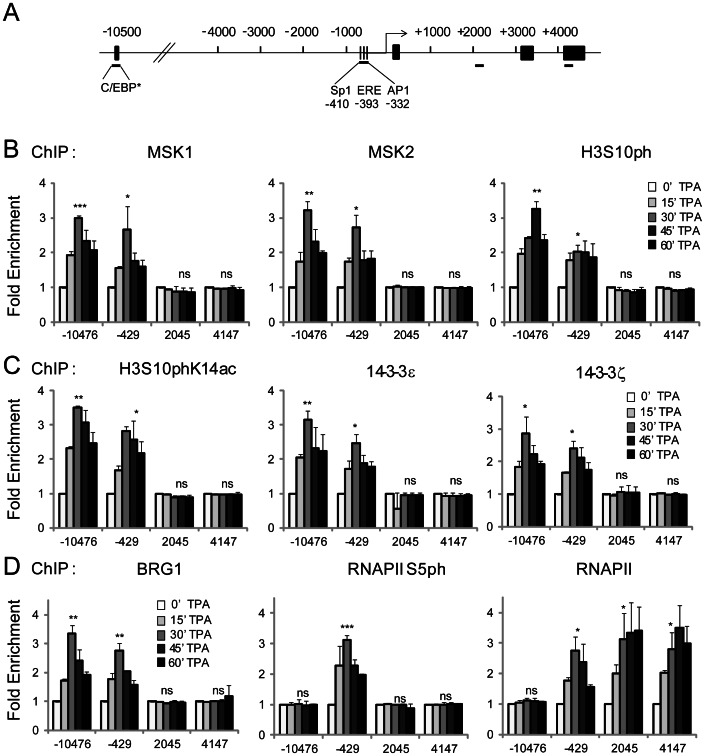
Figure 2. Distribution of MSK1/2, H3S10ph, H3S10phK14ac, 14-3-3ε/ζ, BRG1, RNAPolIIS5ph, and RNAPolII at regulatory and coding regions of TFF1 in response to TPA.
A. Schematic representation of TFF1 gene structure. Black bars underneath the map show regions amplified in the ChIP assay. Each region is labeled according to the 5′ position of the forward primer relative to the transcription start site. The exons are represented by black boxes, while the binding sites of relevant transcription factors located in the amplified enhancer (−10476) and UPE (−429) regions are displayed. C/EBP, CCAAT-enhancer binding protein; Sp1, GC box that is a binding site for the Sp family of transcription factors; ERE, estrogen response element; AP1 constitutes a combination of dimers formed of members of the JUN, FOS and ATF families of transcription factors. Asterisk indicates a putative binding site. B. ChIP assays were performed using antibodies against MSK1, MSK2 or H3S10ph on formaldehyde-crosslinked mononucleosomes prepared from serum-starved MCF-7 cells either untreated (0′ TPA) or treated with TPA for 15, 30, 45 and 60 min. Equal amounts of input and immunoprecipitated DNA were quantified by real-time quantitative PCR. Enrichment values are the mean of three independent experiments, and the error bars represent the standard deviation. C. ChIP experiments were performed as in B, using antibodies against H3S10phK14ac, 14-3-3ε or 14-3-3ζ. D. ChIP experiments were performed as in B and C, using antibodies against BRG1, RNAPII S5ph or total RNAPII. *P≤0.05, **P≤0.01, ***P≤0.001, ns = P≥0.05 (Student’s paired t-test).

