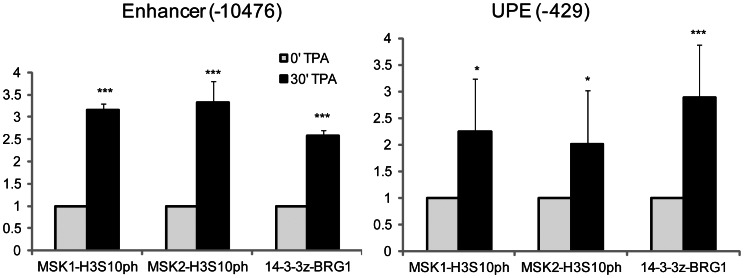
Figure 3. TPA-induced co-occupancy of MSK1/H3S10ph, MSK2/H3S10ph and 14-3-3ζ/BRG1 at regulatory regions of TFF1.
Re-ChIP experiments were performed on formaldehyde-crosslinked mononucleosomes prepared from serum-starved MCF-7 cells either untreated or treated with TPA for 30 min. The antibodies were used as indicated in the graph. Equal amounts of input and immunoprecipitated DNA were quantified by real-time quantitative PCR. The enrichment values of the TFF1 enhancer (-10476) and UPE (-429) sequences are the mean of three independent experiments, and the error bars represent the standard deviation. *P≤0.05, **P≤0.01, ***P≤0.001 (Student’s paired t-test).

