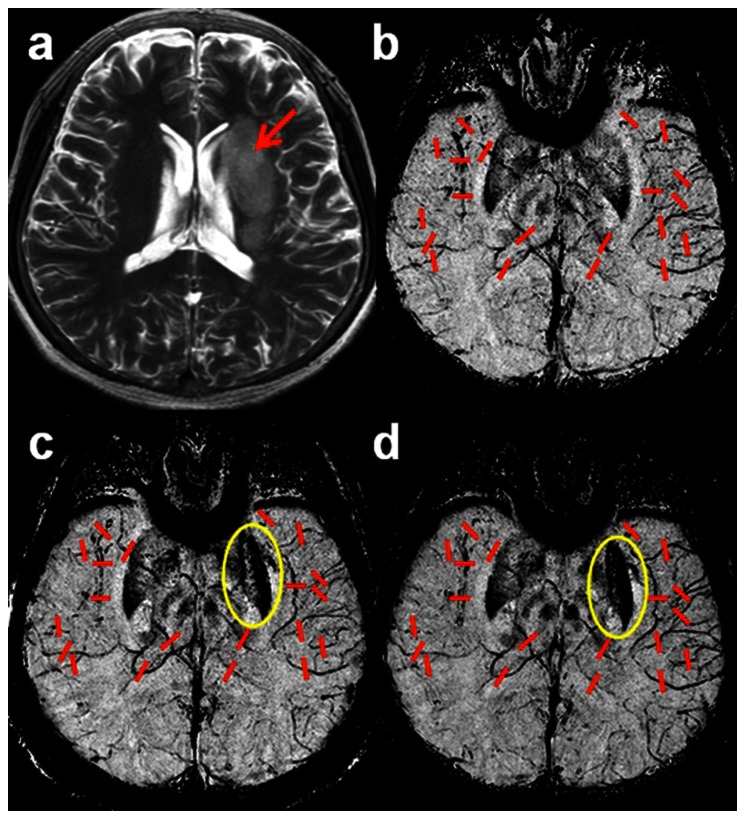
Figure 2. Vessel selection for a stroke patient.
a) maximum intensity projection over 3 slices of T2 weighted imaging shows stroke affected area (red arrow). b), c) and d) minimum intensity projections over 20 slices of SWI processed phase images showing the locations of the 10 measured vessels (red lines) for each hemisphere at (b)<24 hours, (c) 2 to 3 weeks after stroke, and (d) 2 months after the onset of stroke. SWI shows hypointense signal on the stroke side of the brain (c,d), and also a hemorrhage (yellow circle) in the left putamen in the second and third scans (c,d).

