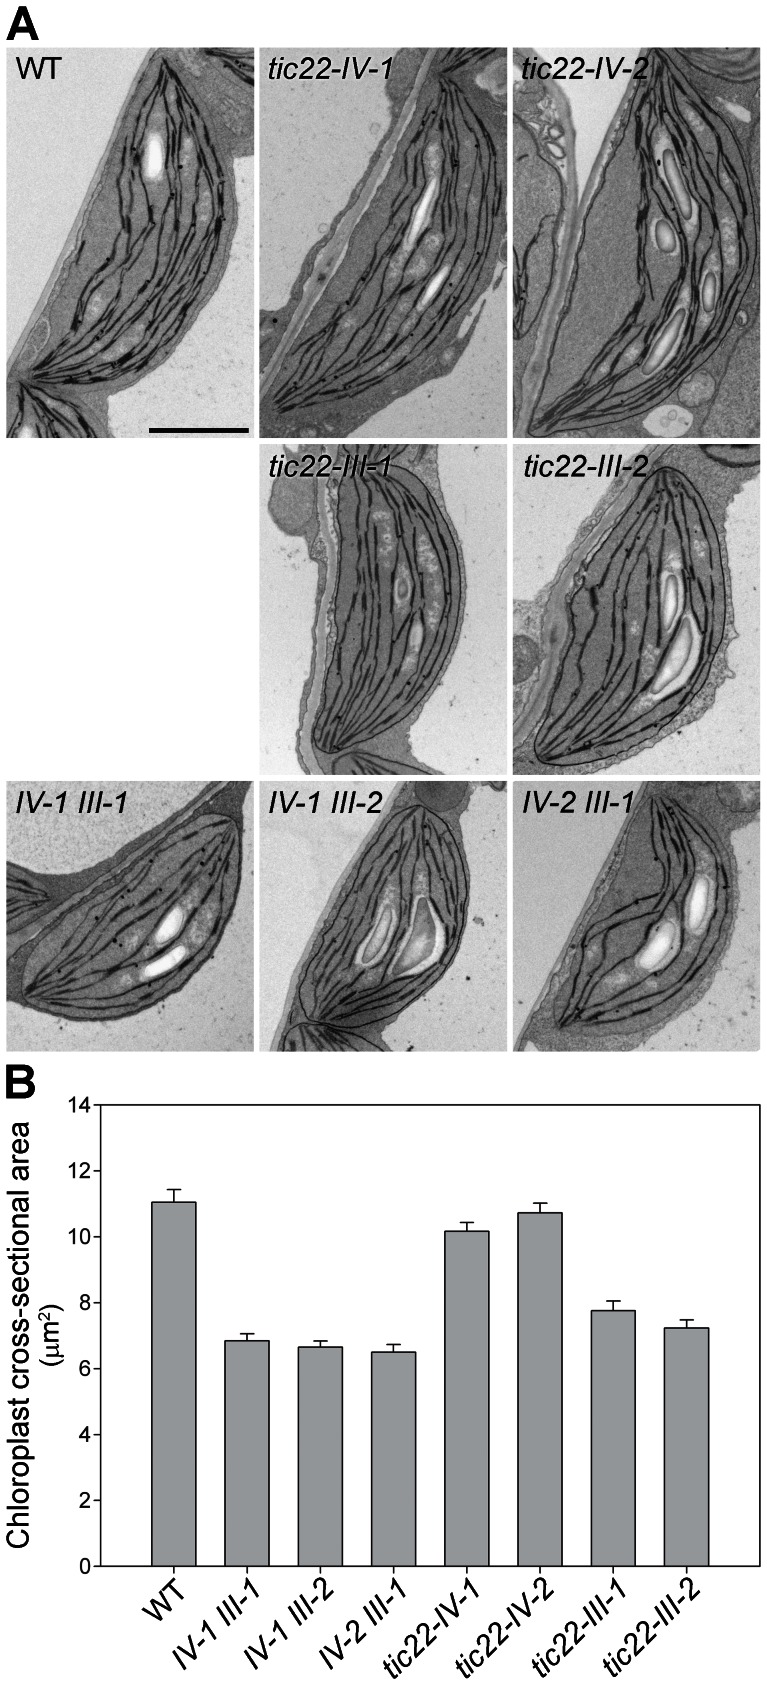
Figure 5. Analysis of plastid ultrastructure in the tic22 single and double mutants.
A. Cotyledons of 5-day-old plants were analysed by transmission electron microscopy. On average, ∼20 whole-chloroplast micrographs from each of three (two in the case of tic22-IV-2 tic22-III-1) independent plants per genotype (a minimum of 50 chloroplasts per genotype) were analysed for each genotype, and used to select the representative images shown. Size bar = 1.0 µm. B. Cross sectional area (µm2) of chloroplasts from the cotyledons of wild type and the tic22 mutants was determined by the analysis of the micrographs described in A. At least 50 chloroplasts were measured for each genotype.

