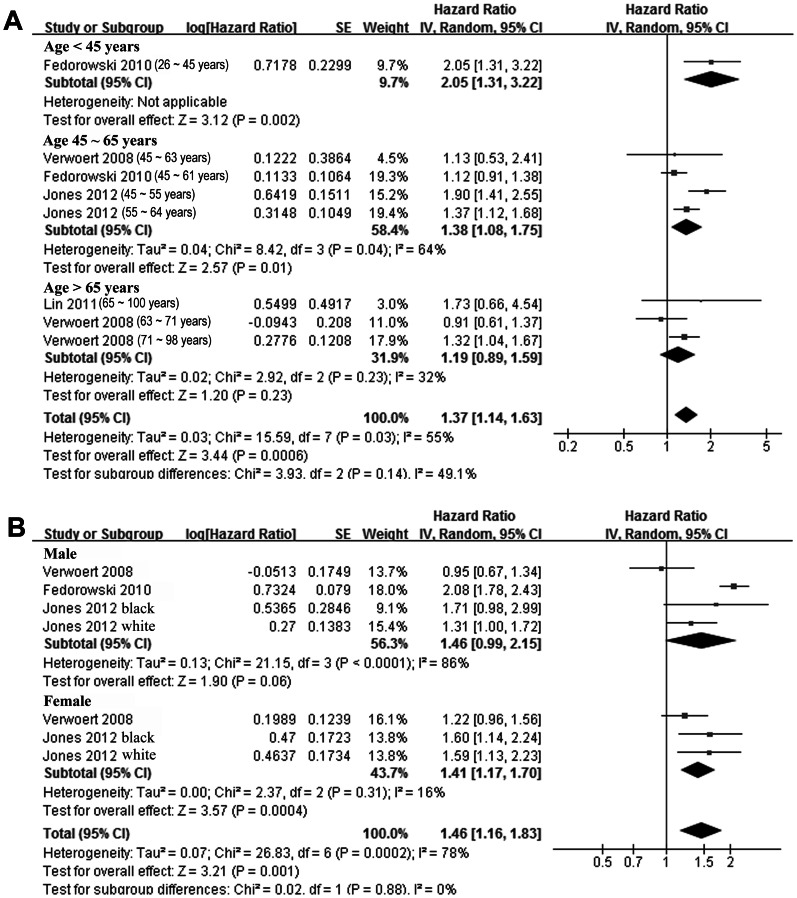
Figure 3. Adjusted hazard ratio of congestive heart failure in subjects with orthostatic hypotension at baseline compared those without orthostatic hypotension stratified by the age ranges (A) and gender (B) of the subjects.
CI, denotes confidence interval; the size of each square is proportional to the study’s weight (inverse of variance – IV).

