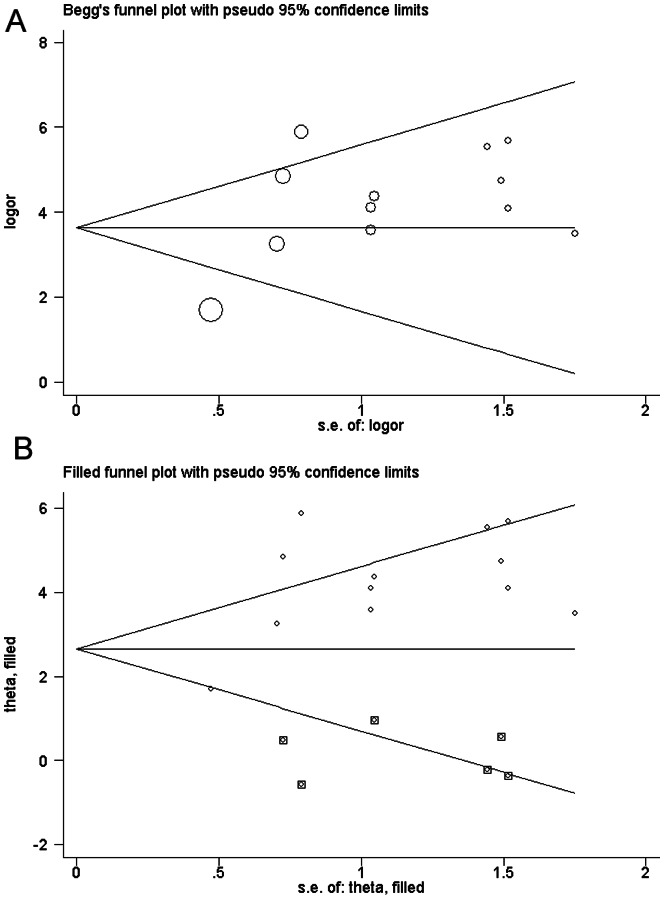
Figure 1. Begg's funnel plot with pseudo 95% confidence limits of publication bias test for RASSF1A methylation.
Each point represented a separate study for the indicated association. Logor natural logarithm of OR, horizontal line mean effect size. A: Begg's funnel plot of publication bias test. B: Begg's funnel plot of publication bias test after trim-and-fill method.

