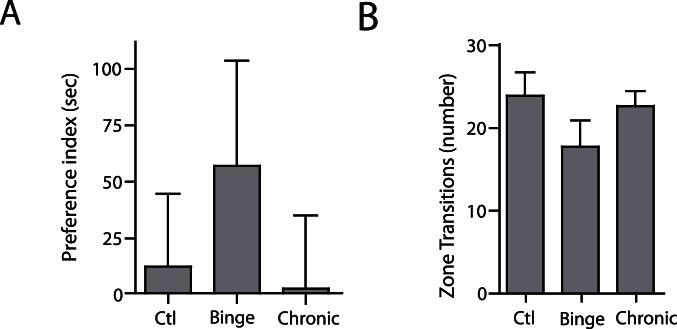
Figure 4. Dark preference and zone transitions after nine days of withdrawal.

(A) The preference index was calculated as in Figure 3. No group showed a significant preference for light versus dark. There were no significant differences between groups (One way ANOVA, F (2, 39) p = 0.5487; n = 15 for control, n = 12 for weekly-binge, n = 15 for daily-moderate). (B) The number of zone transitions were calculated as in Figure 3. There were no significant differences in number of zone transitions between groups nine days after ethanol exposure. (One way ANOVA, F (2,39) = 1.592, p = 0.2164; n = 15 for control, n = 12 for weekly-binge, n = 15 for daily-moderate).
