Fig. 1.
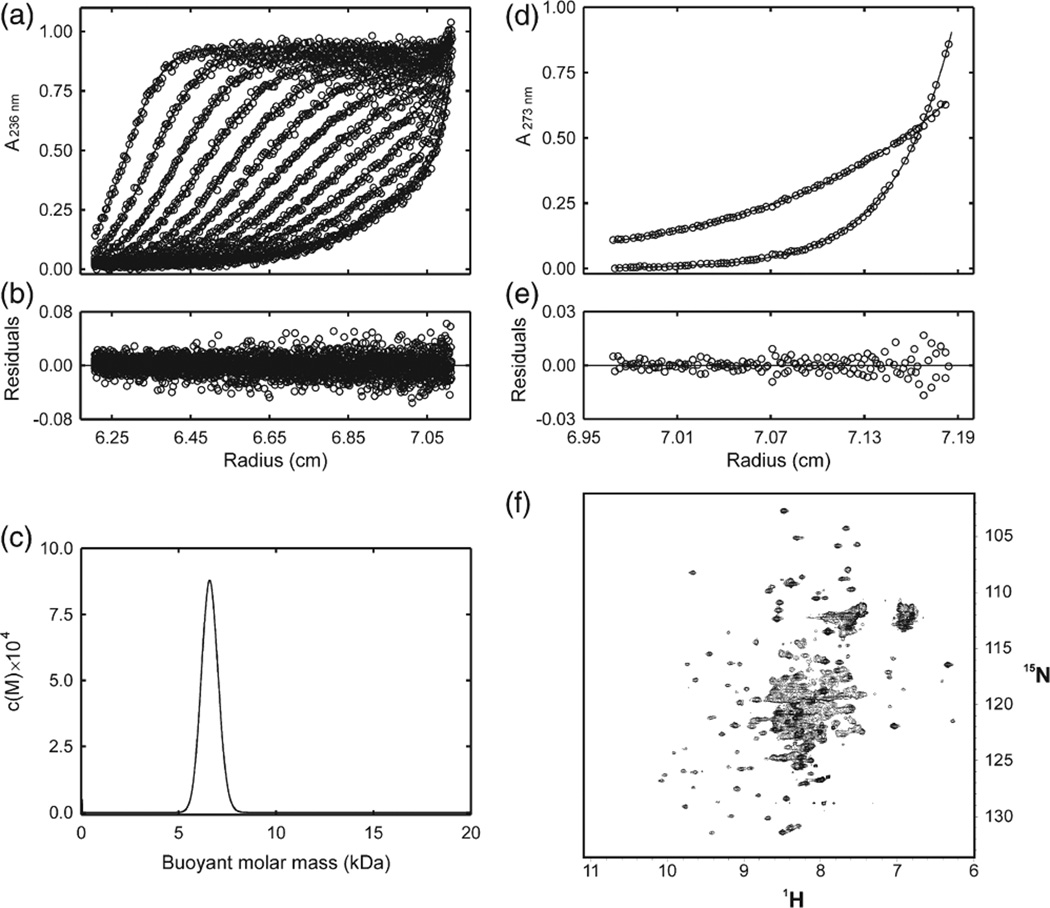
NMR and analytical ultracentrifugation analysis of elonginBC. (a) Radial profiles of 0.92 mg/mL elonginBC monitored at 236 nm during centrifugation at 40,000 rpm (○). The sedimentation velocity data were analyzed in terms of a continuous buoyant molar mass distribution (−) using the continuous mass distribution model [c(M)] resident in the program SEDFIT. Ninety scans were used in the analysis; however, for clarity, only every seventh is presented. (b) Plot of residuals for the analysis of the experimental data in (a). (c) c(M) distribution describing the experimental data in (b). The distribution exhibits a single, well-defined maximum corresponding to a buoyant (reduced) molar mass of 6.5 kDa. This corresponds to a physical mass of 24.5 kDa under the conditions used. The predicted mass of a 1:1 complex is 25.6 kDa. (d) Radial profiles of 0.92 mg/mL elonginBC monitored at 273 nm after centrifugation for 24 h at 20,000 and at 35,000 rpm. The sedimentation equilibrium data were globally analyzed in terms of a single ideal solute (−) using the species analysis model resident in the program SEDPHAT. The buoyant molar mass recovered from the analysis was 6.7 kDa. This corresponds to a physical mass of 25.1 kDa under the conditions used. (e) Plot of residuals for the analysis of the experimental data in (d). (f) 1H–15N HSQC analysis of elonginBC. Recombinant elonginBC, 0.25 mM in 20 mM potassium phosphate, 2.5 mM DTT, pH 6.7, was recorded at 310 K on a Bruker Avance 500 spectrometer. Note the concentration of broad overlapped peaks in the centre of the spectrum indicating conformational exchange.

