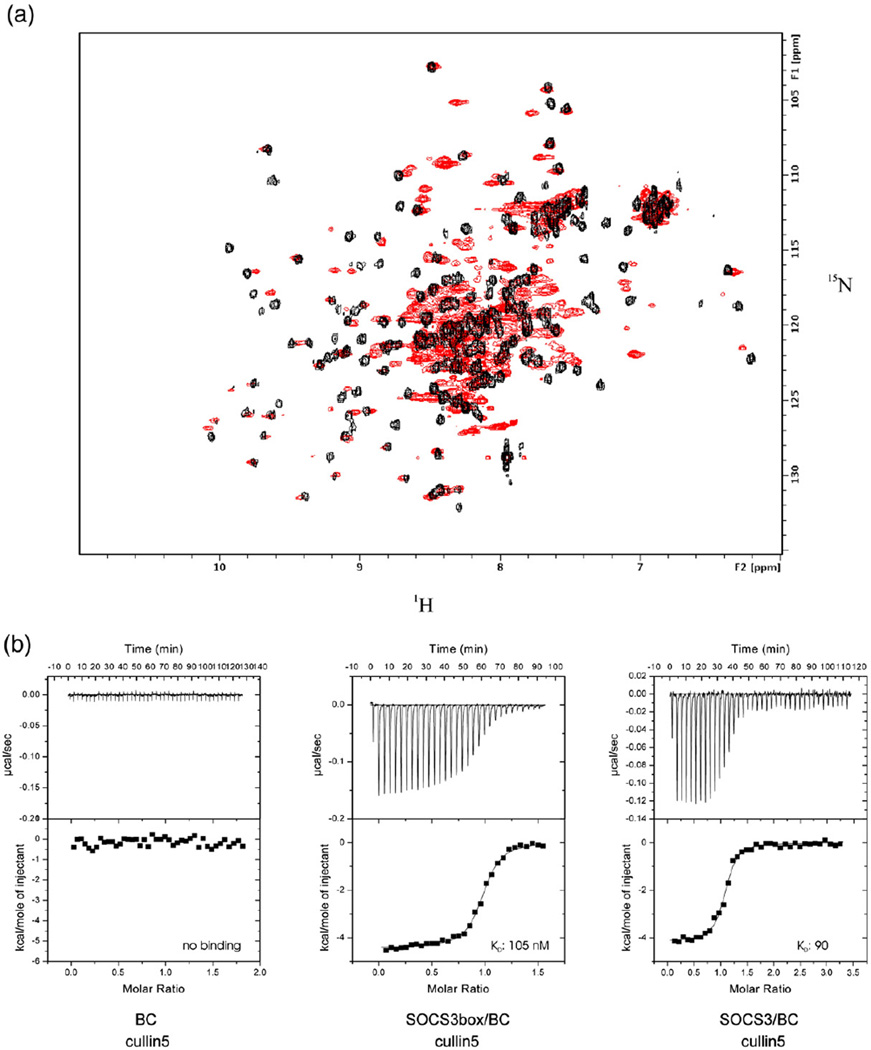
Fig. 2.
SOCS3 and elonginBC forms a stable ternary complex that binds tightly to cullin5. Overlay of the 15N HSQC spectrum of elonginBC alone shown in red with that of elonginBC (15N labelled) in complex with the SOCS3 box (unlabelled) shown in black. The broad peaks in the centre of the elonginBC-alone spectrum are shifted and well resolved in the ternary complex, indicating little, if any, conformational exchange once the SOCS box is bound. (b) ITC analysis of the SOCS3 SOCS box–elonginBC–cullin5 interaction. GST–cullin5 (80 µM, NTD) was titrated into 10 µM elonginBC, SOCS3box/elonginBC or SOCS3/elonginBC in 30×10-µL injections using a VP-ITC unit (Microcal). Both protein and peptide were prepared in 20 mM potassium phosphate and 100 mM NaCl supplemented with 2 mM 2-mercaptoethanol. Only the SOCS3box–elonginBC and SOCS3–elonginBC ternary complexes bound to cullin5 with measurable affinity. These titration curves fitted well to a single-site model with a Kd of 105±10 nM, ΔH −3700±500 cal/mol, N=0.96 and Kd of 90±10 nM, ΔH −4100±200 cal/mol, N=1.05, respectively (average of duplicate experiments).

