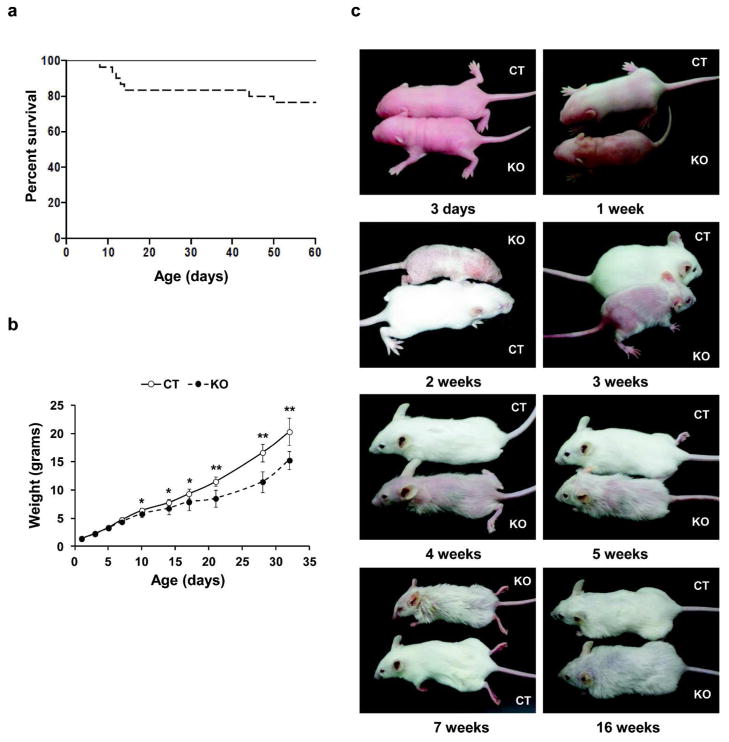
Figure 1. Survival rate, growth curve and phenotype of GPx4 knockout and control mice.
(a) Kaplan-Meier survival plot of GPx4 knockout (– – –, n=30) and control mice (——, n=54), with a cumulative survival proportion of 0.76 for knockout pups. (b) Growth curve of knockout (– – –, n=14) and control (——, n=23) littermates showing weight variations in the two mouse lines. (c) Phenotype of age matched knockout (KO) and control (CT) mice showing defective hair development, a less dense and furry hair coat in knockout offspring compared to control littermates. Error bars represent mean ± S.D. **, p ≤ 0.001; *, p ≤ 0.05.

