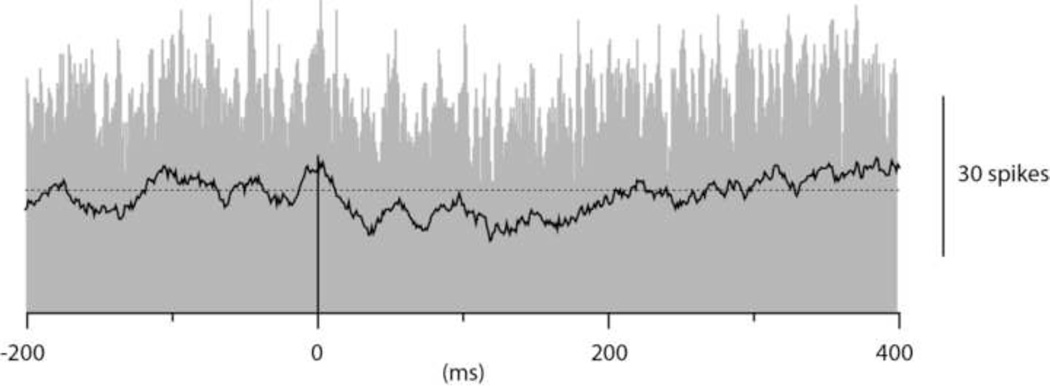
Figure 5.
Cross-correlation between the spikes of a Golgi cell and granule cell spike firing. Similar display as in Fig. 2. To facilitate the illustration of the underlying trend in the depression of the granule cell spike firing, a moving average of 20 bins is superimposed on the peristimulus histogram. Bin width 1 ms.

