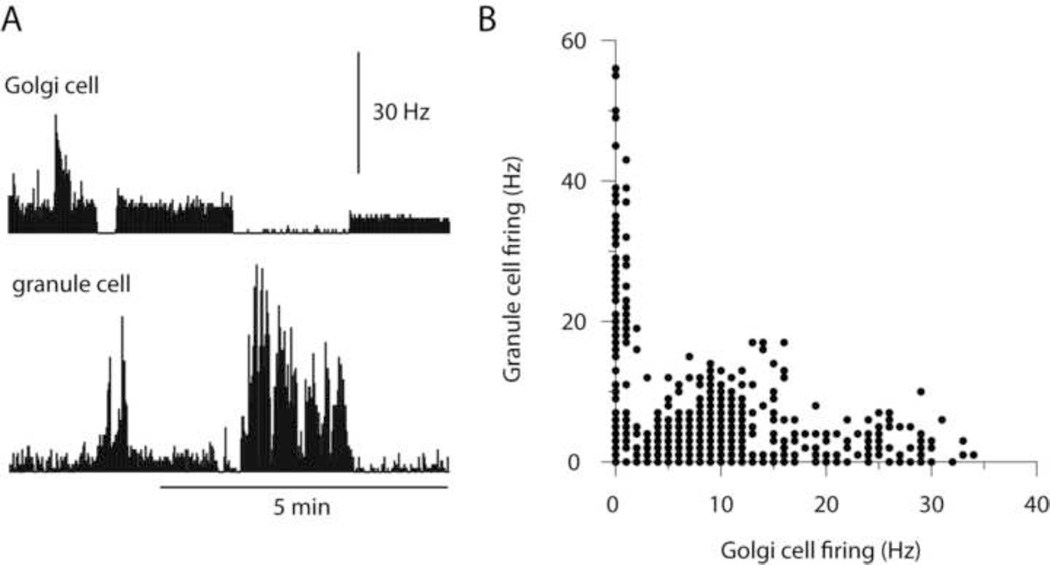
Figure 6.
Long-term relationship between Golgi cell and granule cell spike activity. (A) The normally quite regular Golgi cell spike firing frequency was altered to a few different levels using current injection. The simultaneously recorded granule cell substantially changed its firing frequency in response to these manipulations. Bin width, 1 s. (B) Scatter plot of the relationship between the spontaneous firing frequencies of the two cells. Note in particular the close connection between high granule cell activity and low Golgi cell activity.

