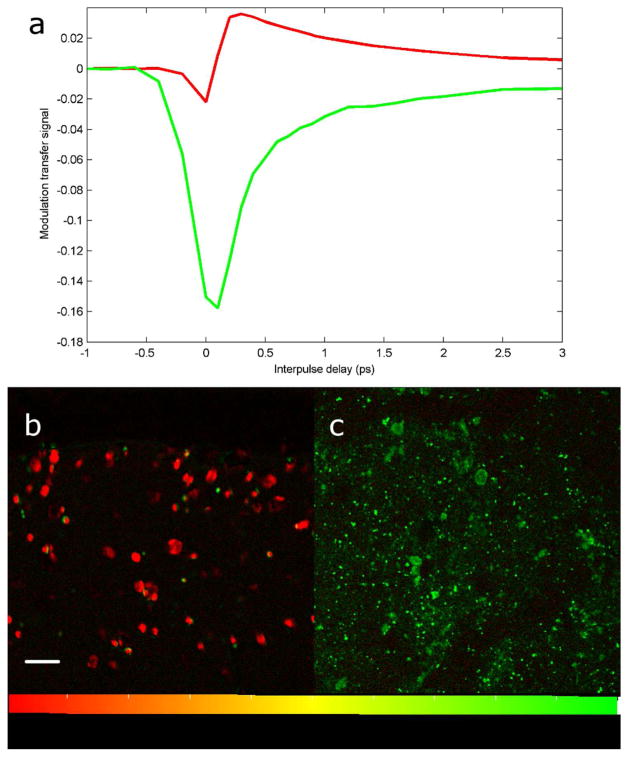
Figure 1. Melanin spectroscopy and skin phantoms.
Pump-probe melanin spectra averaged over the entire field of view (a); sepia melanin in red, synthetic pheomelanin in green. Images of sepia melanin (b) and synthetic pheomelanin (c) embedded in agarose. Images have been processed using linear decomposition. Small artifacts in Figure 1b arise from residual motion in the agarose, and reflect the high sensitivity of the technique-this motion is not present in the skin samples in later figures. Scale bar = 100 μm.

