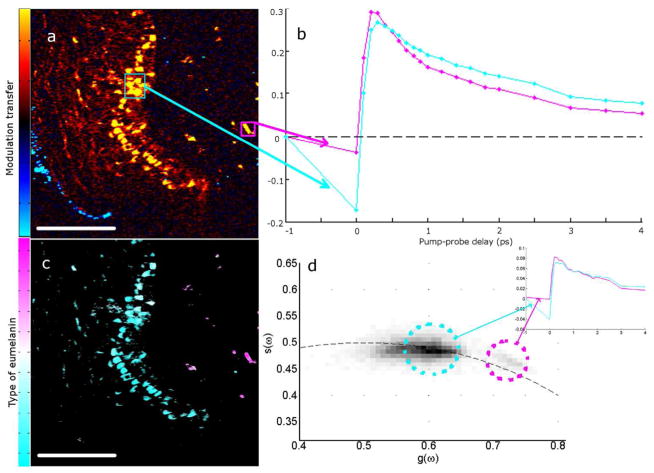
Figure 3. Melanin in macrophages differentiated from epidermal melanin.
(a) Malignant melanoma imaged at approximately 300fs pump-probe delay. Skin surface is on the left with the surgical ink appearing blue. False color scheme is the sign of the signal, yellow for positive and cyan for negative. (b) Delay traces averaged over two regions of interest in (a) of corresponding colors. (c) Image of (a) recolored using phasor analysis at 0.1 THz. (d) Phasor plot showing all of the pixels from 6 images that contain both epidermal and macrophage melanin. Pixels in (c) are colored magenta or cyan according to which population they fall into (or a combination of the colors if the pixel is in both populations). Inset graph shows the average spectrum of pixels in each population from the 6 images. Scale bar = 100 μm.

