
FIGURE 3.
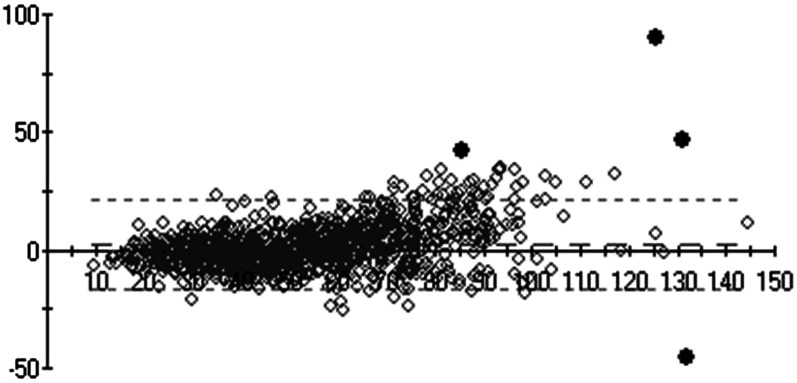
Bland-Altman comparison plot (y axis: standardized LC–tandem MS–measured minus LC–tandem MS–predicted differences; x axis: mean of LC–tandem MS–predicted and LC–tandem MS–measured values) of serum 25(OH)D of National Adult Nutrition Survey samples (n = 1118) measured by using standardized LC–tandem MS at University College Cork and predicted as per Vitamin D Standardization Program protocol 2. The diamonds indicate individual data points. Four black data points represent those that were deemed outliers by using an outlier limit of 4 SDs. LC–tandem MS; liquid chromatography–tandem mass spectrometry; 25(OH)D, 25-hydroxyvitamin D.