Fig. 3.

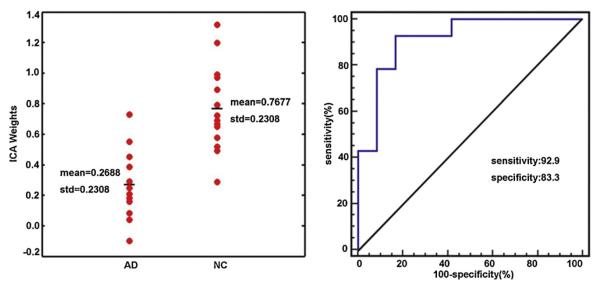
The effects of discrimination from ICA weights in AD patients and NC for the combined source. The left panel shows the scatterplot of ICA weights. The right panel shows the ROC of the discriminability.

The effects of discrimination from ICA weights in AD patients and NC for the combined source. The left panel shows the scatterplot of ICA weights. The right panel shows the ROC of the discriminability.