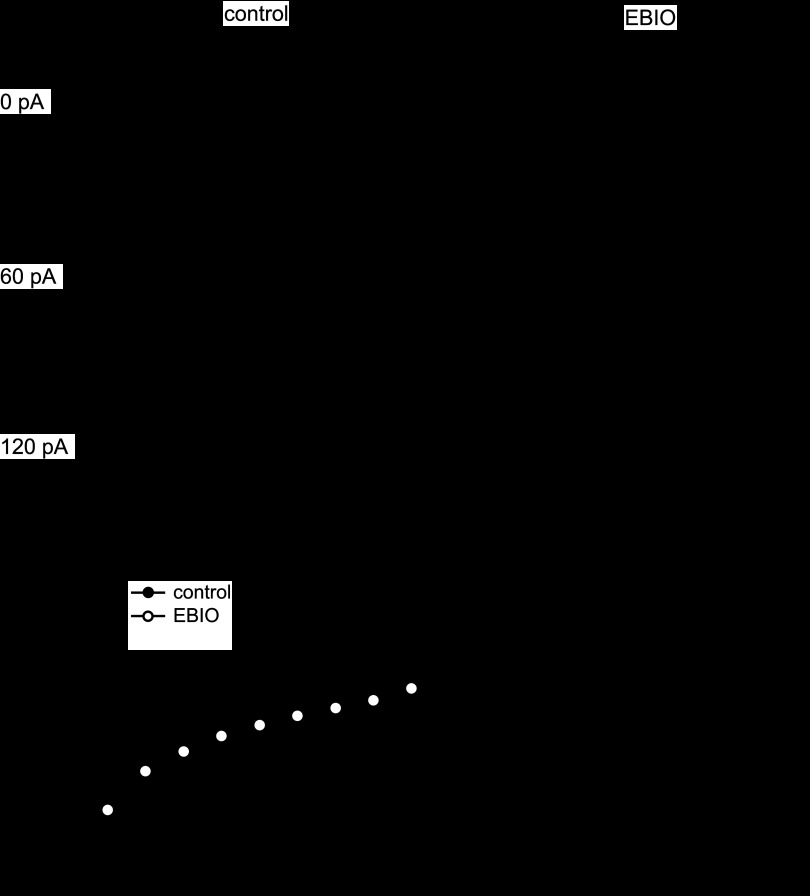
Fig. 7.
Modulation of the input-output curve by EBIO. A: spontaneous and driven action potentials evoked by 200-ms current injections (amplitudes as labeled) before (left) and after (right) application of 10 μM EBIO. Calibration bars apply to all traces. B: input-output curves in the absence (closed symbols) or presence (open symbols) of EBIO (n = 7).

