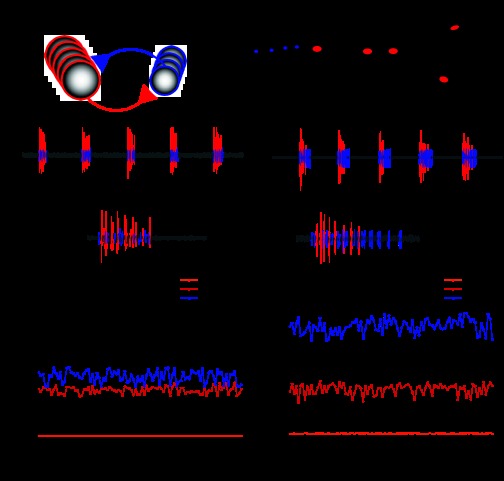
Fig. 1.
Extracellular recordings of the cardiac ganglion (CG) showing variable phase relationships. A: schematic network diagram of the CG. The network consists of nine neurons: five motor neurons [“large cells” (LCs)] and four interneurons [“small cells” (SCs)]. B: anatomic schematic diagram of the CG showing extracellular recording sites. Blue circles represent SC soma; red circles represent LC soma. Dotted circles represent extracellular recording wells. Our primary recordings were from the site in the middle of the ganglion, the anterior trunk. The additional recording site on the motor nerve was used to ensure that spikes recorded from the anterior trunk were correctly identified. C and D: extracellular recordings from the anterior trunk in two experimental preparations of the CG. SC and LC spikes are colored as blue and red, respectively. Note that LC activity was similar in terms of frequency and burst duration, meaning that cardiac output was likely to be similar in both preparations. In C, LCs and SCs initiate and terminate their bursts nearly simultaneously. In D, LCs and SCs initiate their bursts together but terminate their bursts at different time points. E and F: cycle-to-cycle calculation of phase for 100 cycles of the recordings shown in C and D. Note that the phases of SC and LC burst offset were substantially different between the two preparations as well as more variable over the course of the experiment on a cycle-to-cycle basis. E: cycle-to-cycle calculation of phase for the preparation shown in C. F: cycle-to-cycle calculation of phase for the preparation shown in D.

