Fig. 5.
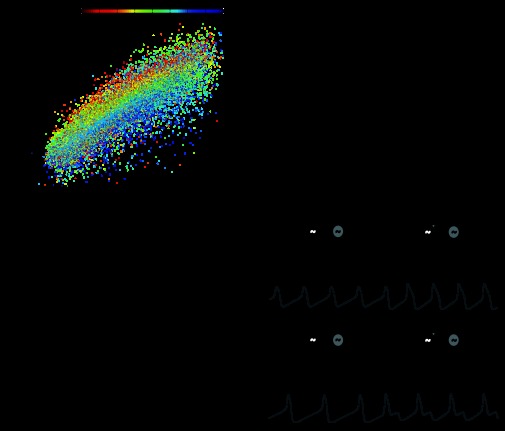
The phasing of the model networks is strongly determined by the intrinsic duty cycles of the two oscillators. A: scatterplot of the intrinsic duty cycle versus the network duty cycle for all model oscillators (n = 26,282), showing a strong positive correlation (pairwise linear regression, R2 = 0.78). The color of each point represents the intrinsic duty cycle of the other oscillator within the network (see color bar). B: the difference in intrinsic duty cycle displayed a strong positive correlation with the network duty cycle difference (R2 = 0.68). C: the difference between the intrinsic frequencies had only marginal effects on network phasing in the models (R2 = 0.08). D: voltage traces showing intrinsic oscillator activity and network activity. Chemical and electrical coupling were absent at the beginning of each trace (see schematics above traces) and were inserted into the model at the time points marked by the arrows. Scale bars = 30 mV and 500 ms. The left trace shows oscillators with similar intrinsic duty cycles but different intrinsic frequencies. When coupled, the oscillators continued to display similar duty cycles. Model parameters were as follows: top oscillator [maximal conductance for Ca2+ current (gCa), 65.5; maximal conductance for K+ current (gK), 80.5; maximal conductance for leak current (gL), 2.41; and maximal conductance for excitatory chemical synapses (gsyn), 22.3], bottom oscillator (gCa, 19.6; gK, 58.1; gL, 9.15; and gsyn, 0.785), and electrical coupling [strength of electrical coupling (ggap), 36.3]. The right trace shows oscillators with similar intrinsic frequencies but different intrinsic duty cycles. Once coupled, the oscillators displayed disparate duty cycles. Model parameters were as follows: top oscillator (gCa, 24.8; gK, 93.6; gL, 1.87; and gsyn, 5.25), bottom oscillator (gCa, 63.5; gK, 62.6; gL, 7.62; and gsyn, 2.67), and electrical coupling (ggap, 11.9).

