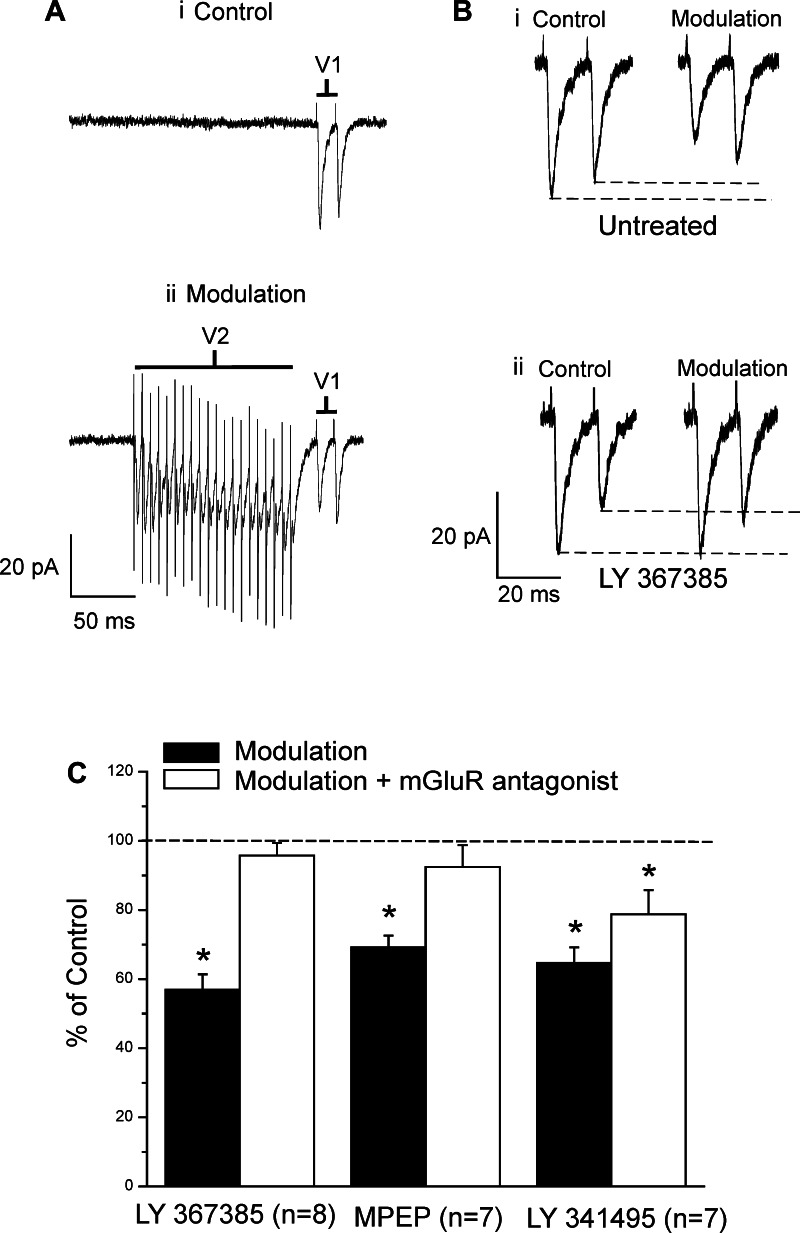
Fig. 4.
Modulation of the Class 1 input to layer 4 of V1 via high-frequency stimulation of V2. A: example of traces showing the modulation protocol. Stimulating electrodes were placed in V1 (white matter) and in V2 (layer 4). In the control condition, V1 white matter was stimulated with 2 pulses at 66 Hz (i). In the modulation condition, V2 was stimulated first at high frequency (20 pulses at 130 Hz). Stimulation of V1 white matter (2 pulses at 66 Hz) followed 20 ms after the last stimulation pulse delivered in V2, which means that the responses to V1 white matter stimulation were evoked during the activation of mGluRs from V2 stimulation (ii). B: same example shown in A with focus on the effects of modulation on the amplitudes of the EPSCs. Stimulation of V1 white matter alone (control) at 66 Hz induced paired-pulse depression. Pairing this with V2 stimulation as in A (modulation) decreased both EPSCs (i). This effect of modulation was prevented by bath application of the mGluR1 antagonist LY-367385 (ii). C: graph showing the effects of modulation (means ± SE) with and without various mGluR antagonists on the amplitude of the first EPSC. *P < 0.05, paired t-test. MPEP, 2-methyl-6-(phenylethynyl)pyridine.

