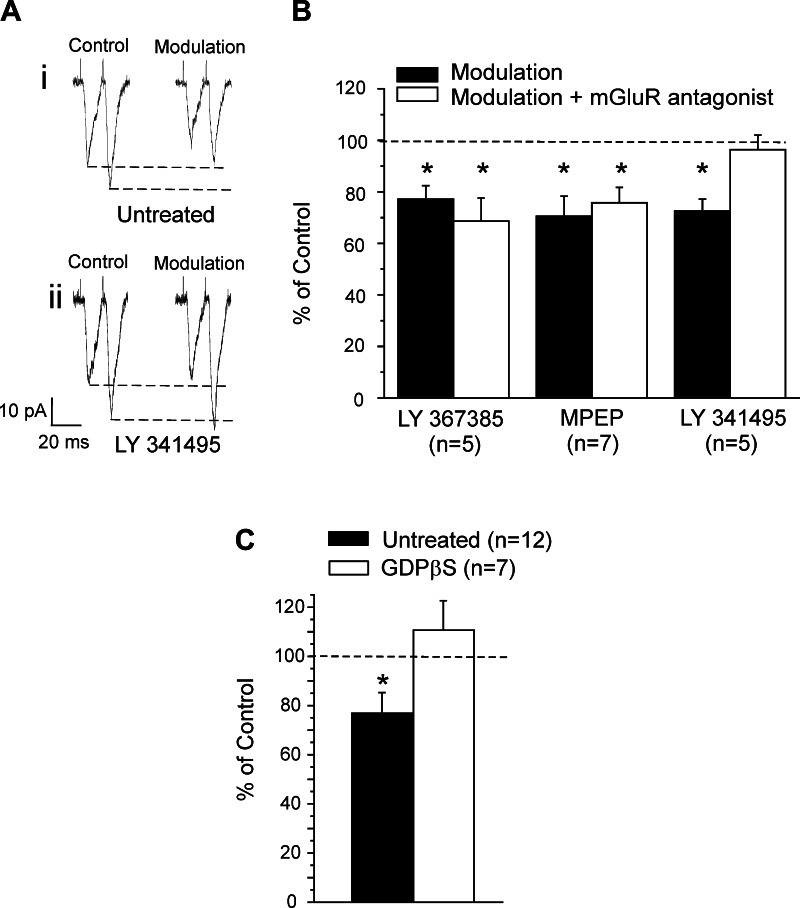
Fig. 6.
Modulation of the Class 2 input to layer 4 of V1 via high-frequency stimulation of V2. A: example of traces showing the effects of modulation on the amplitudes of the EPSCs. Stimulation at 66 Hz caused paired-pulse facilitation, and both EPSCs were similarly decreased by modulation (i). Effects of modulation were blocked by group II mGluR antagonist LY-341495 (ii). B: graph showing the effect of modulation on the amplitude of the first EPSC; conventions as in Fig. 5B. C: graph showing the effect of modulation on the amplitude of the first EPSC for untreated neurons and for GDPβS-treated cells. Amplitudes (means ± SE) are normalized to the values measured in the control condition. *P < 0.05, paired t-test.

