
Fig. 12.
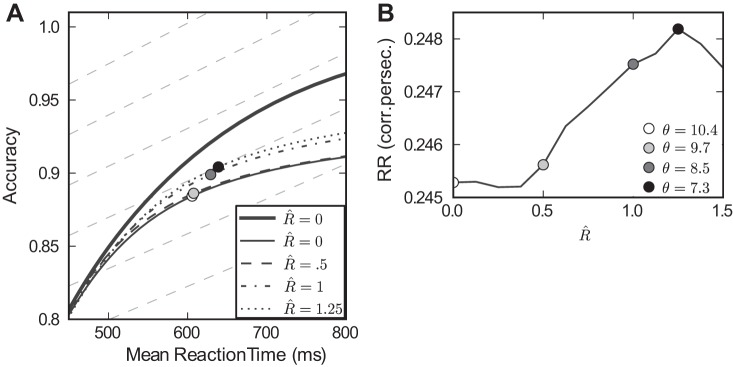
Robustness improves reward rate (RR) under mistuning. A: speed accuracy curves plotted for multiple values of R̂; as in previous figures, the greater accuracies found at fixed mean reaction times indicate that performance improves as R̂ increases. The heavy line indicates the baseline case of a perfectly tuned, nonrobust integrator (repeated from Fig. 5B). RR level curves are plotted in background (dotted lines; see text), and points along speed accuracy curves that maximize RR are shown as circles. These maximal values of RR are plotted in B, demonstrating the nonmonotonic relationship between R̂ and the best achievable RR.