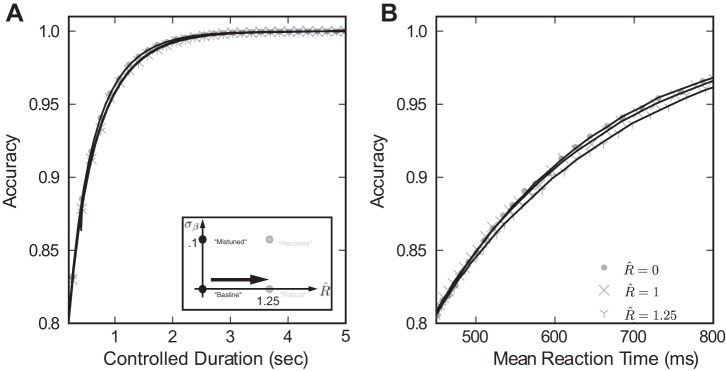
Fig. 7.

Increasing R̂ alone does not compromise performance. Only simulation results, without fitting lines, are plotted for clarity. Inset: we illustrate this by moving in parameter space directly from the baseline to the “robust” model. For both controlled duration (A) and reaction time tasks (B), we plot the relationship between mean reaction time and accuracy. Circles give results for the baseline model, and “x” and “y” markers for the robust model at R̂ = 1 and 1.25, respectively. These curves are very similar in the baseline case, indicating little change in decision performance due to the robustness limit R̂ = 1.25.
