
Fig. 9.
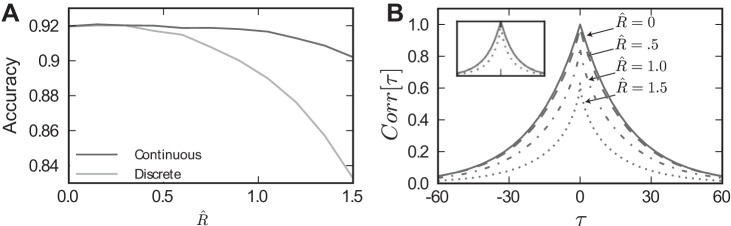
Accuracy of the discrete/independent and continuous/correlated models for the controlled duration task, T = 500 ms. A: approximation of the performance of the continuous/correlated model via Eq. 15 is plotted as a black curve, and that predicted by the discrete/independent model with identical signal increments is plotted as a gray curve. B: disparity in performance of these 2 models can be partially understood by observing the decorrelating effect of R̂ on the autocorrelation function for the evidence stream in the continuous/correlated model. Inset: 2 of these same functions (for R̂ = 0 and R̂ = 1.5) are plotted normalized to their peak value.