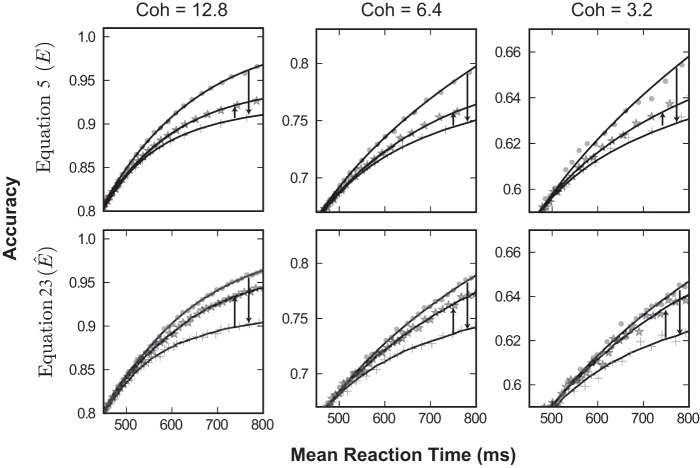
Fig. A4.
Performance comparison of 2 models of robust integration, reaction time task. In each panel, the lines are the same as in Fig. 6 legend. Downward arrows indicates the impact of mistuning: increasing σγ from 0 to 0.1. Upward arrows show the effect of robustness: increasing R̂ from 0 to 1.25. Overall, we see that robustness has an even greater positive impact on the performance of the circuit-based model (here q = 1, r− = 0, r+ = 50, N = 250, κ = 1/9; p is then adjusted to give the required robustness level). Data were generated from 50,000 numerical trials per value.

