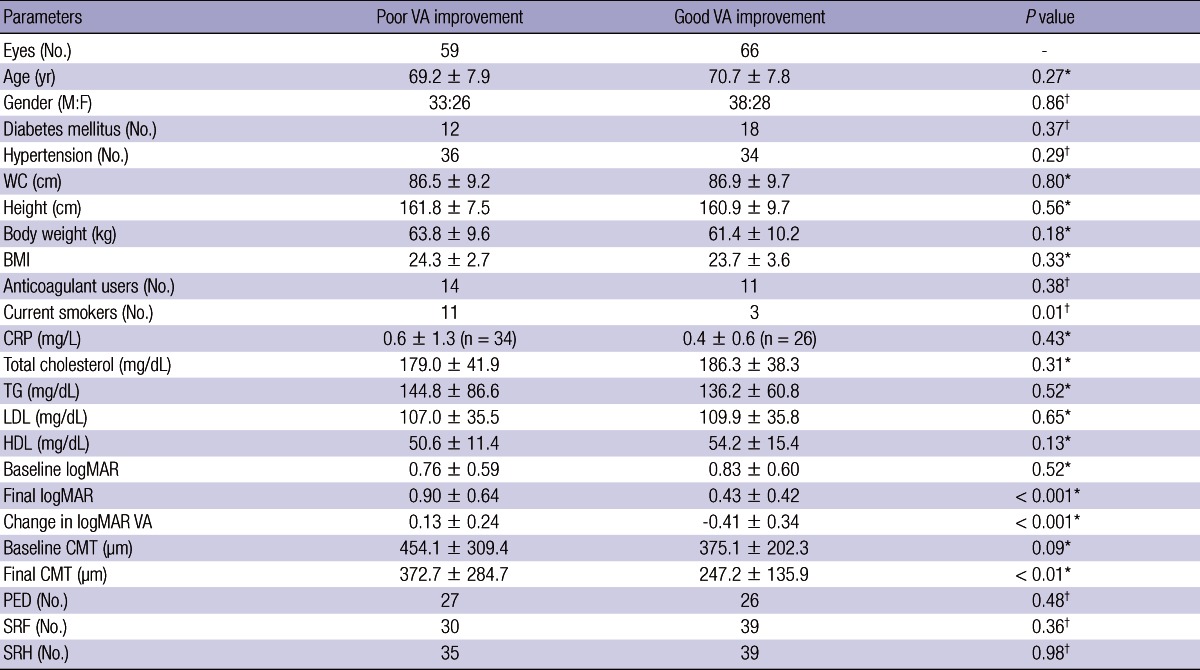
Table 1.
Comparison of the poor and good VA improvement groups, divided by median visual acuity improvement (-0.05 log [minimum angle of resolution]).

*Independent t-test; †Fisher's exact test. BMI, body mass index; CMT, central macular thickness; CRP, C-reactive protein; F, female; HDL, high-density lipoprotein; LDL, low-density lipoprotein; M, male; PED, pigment epithelium detachment; SRF, subretinal fluid; SRH, subretinal hemorrhage; VA, visual acuity; WC, waist circumference.
