
Figure 1.
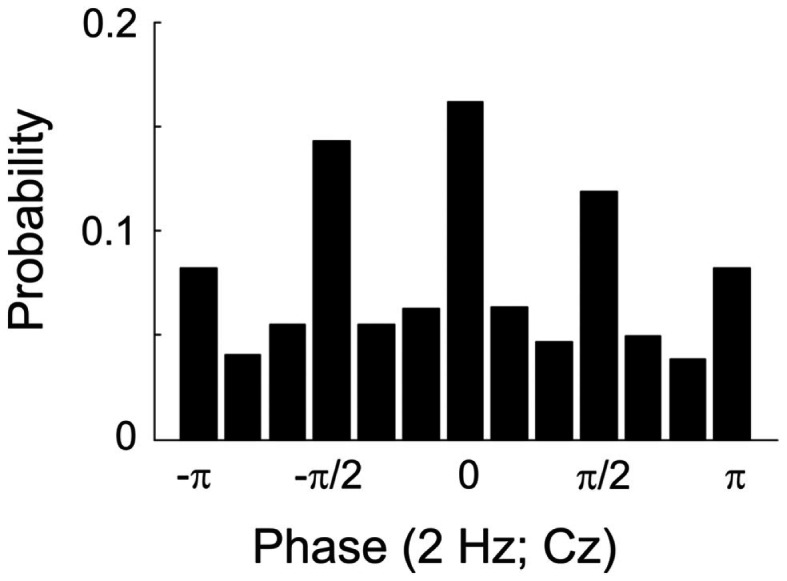
Histogram showing the probability of presenting a tone at particular phases of a 2-Hz oscillation in the EEG (at electrode Cz) in Experiment 1. The full cycle is divided into 12 bins, π/6 or 30° wide. Bins are centered at the values specified. Note that the 12th bin includes both π and −π and is therefore depicted twice.