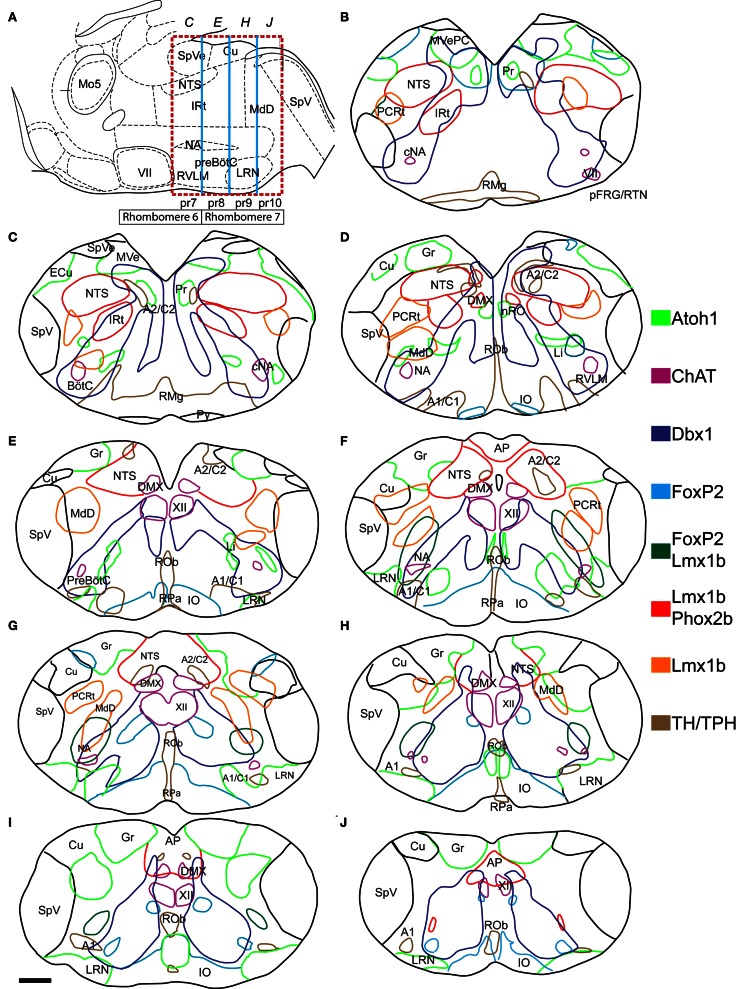
Figure 2.
Atlas of reticular formation developmental origin in neonate mouse medulla. (A) Mid-sagittal cartoon showing approximate region of mapping (red dashed box). Boxes below hindbrain indicate rhombomere 6 and 7 boundaries. Blue lines indicate pseudo-rhombomere 7–10 boundaries. Italicized letters indicate rostro-caudal position of sections in map. Image modified from Franklin (1997). (B–J) Outlines of medullary sections from rostral (B) to caudal (J) are shown. Sections are separated by 100 μm. Colored lines indicate regions where cells expressing or derived from specific TF lineage are present in P0 mouse (see legend). Red indicates regions of Lmx1b and Phox2b co-expression. Location of motoneurons and monoaminergic populations are included for reference. Scale bar = 500 μm. See abbreviations for explanation of text.

