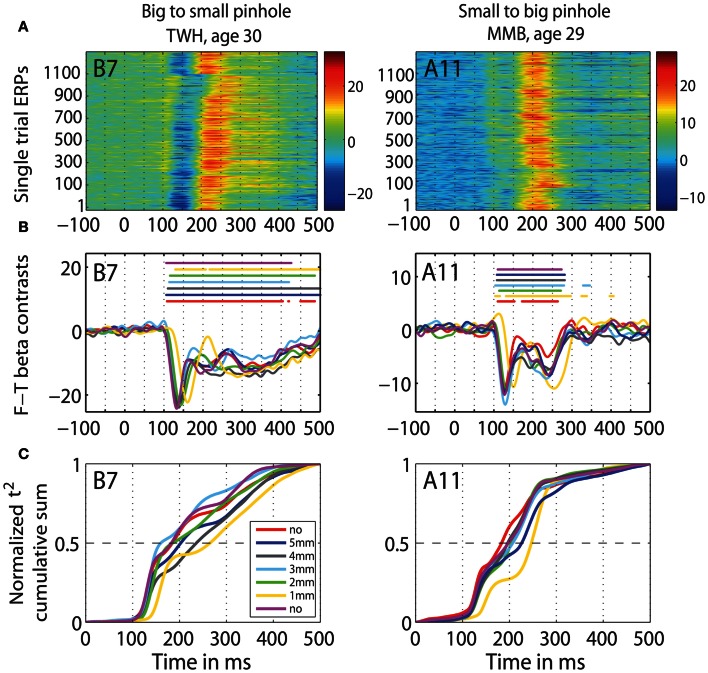
Figure 12.
Individual subjects data. Data of two representative subjects: TWH (age 30), and MMB (age 29) in b2s (column 1) and s2b (column 2) sessions at the max t2 electrode for that subject, indicated in the top left corner of each plot. (A) Single-trial ERPs. (B) Time-courses of contrasts between face and texture beta-coefficients for each pinhole condition. Horizontal lines indicate significant differences. (C) Cumulative sums of t2 functions for each pinhole condition.

