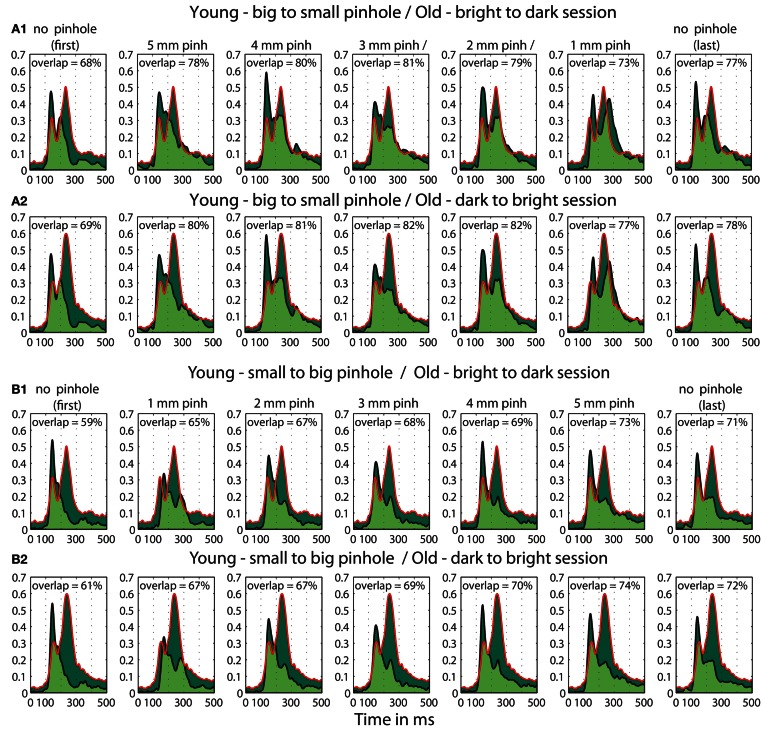
Figure 15.
Overlaps between t2 functions of young subjects tested in the pinhole experiment and old subjects tested in the luminance experiment. (A) Overlap between old (>60) adults in the first brightest (60.8 cd/m2) condition from the b2d (A1) and d2b (A2) session of the luminance experiment and young subjects in all the pinhole conditions of the pinhole experiment's b2s session. (B) Overlap between old subjects in the brightest (60.8 cd/m2) condition from the b2d (B1) and d2b (B2) session of the luminance experiment and young subjects in all the pinhole conditions of the pinhole experiment's s2b session. Each subplot depicts the area under the t2 functions of young and old subjects, shaded in dark green. The edges of the t2 functions for young and old subjects are highlighted in black and in red, respectively. The overlap between t2 functions for young and old subjects is shaded in light green. The proportion of overlap is given inside each subplot.

