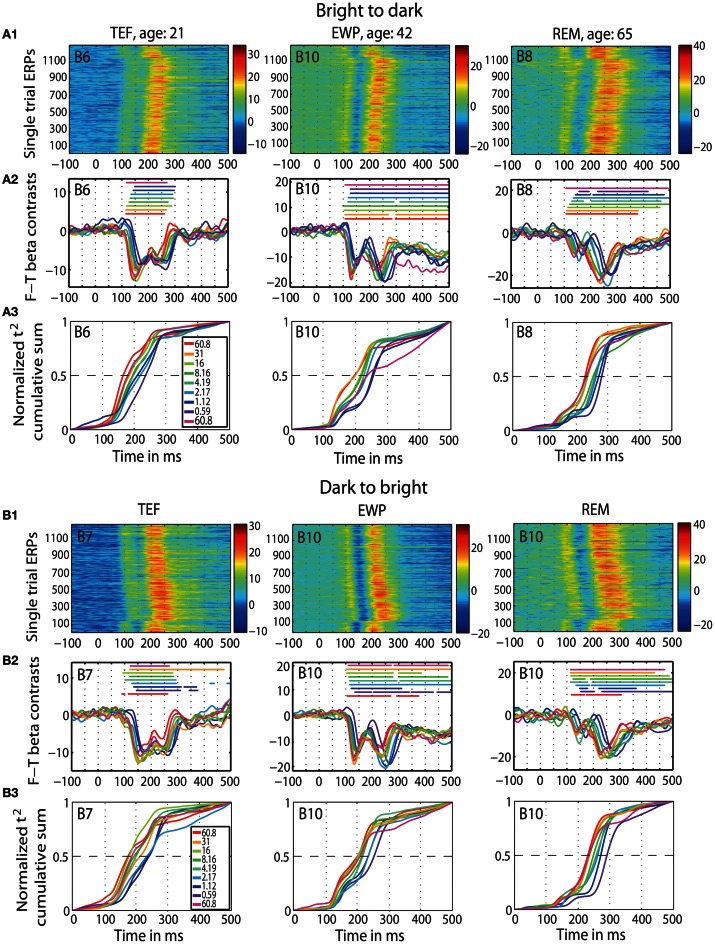
Figure 2.
ERP results in individual subjects. Data of three representative subjects: one young (TEF, age 21), one middle-age (EWP, age 42) and one old (REM, age 65) for b2d session (panel A) and d2b session (panel B) at the max t2 electrode (indicated in the top left corner of each subplot). An electrode map is provided in Figure S4. (A1 and B1) Single trial ERPs, in μV. (A2 and B2) Time-courses of contrasts between face and texture beta-coefficients for each luminance level; horizontal lines indicate significant contrasts. (A3 and B3) Normalized t2 cumulative sums at each luminance level.

