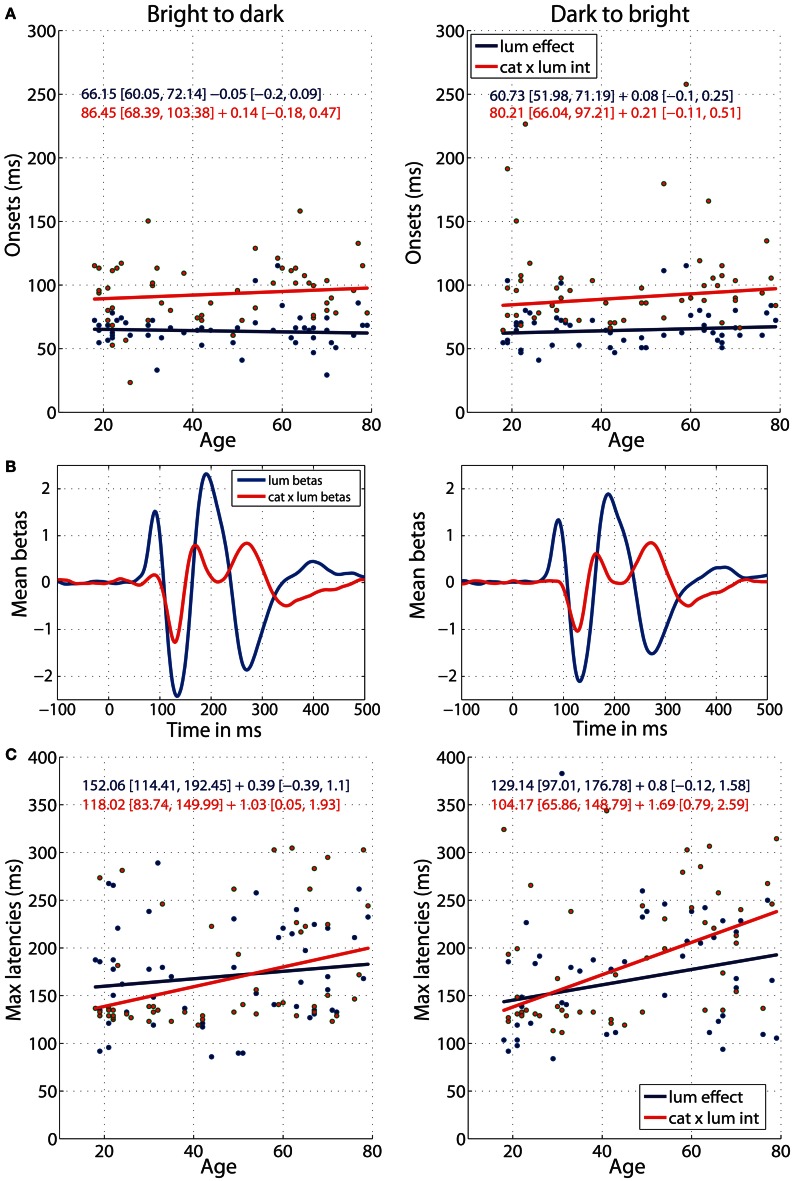
Figure 8.
Regressions of luminance effect and category × luminance interaction against age. (A) Onsets of the two effects against age for b2d (left column) and d2b sessions (right column). (B) Mean (across all subjects) beta coefficients associated with two predictors: luminance and category × luminance interaction. (C) Latencies of the maximum effects against age. Each subplot contains regression equations in the format intercept + slope with their confidence intervals in square brackets. The color of each equation corresponds to the regression line for each effect.

