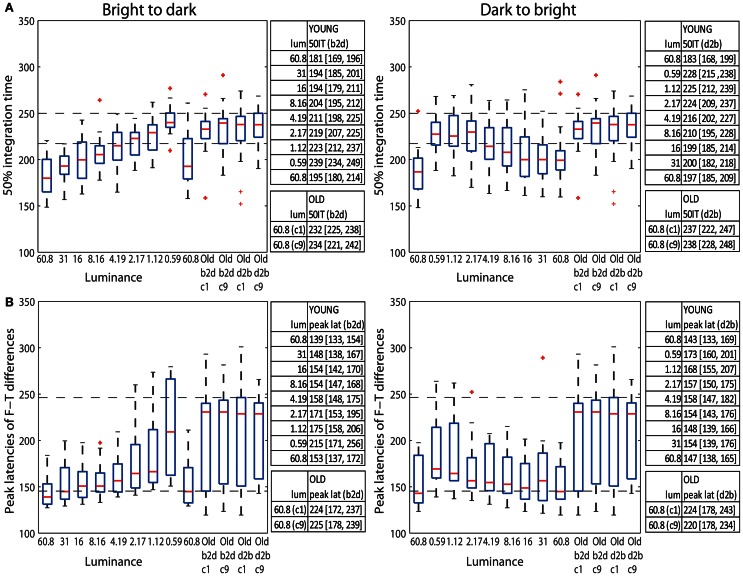
Figure 9.
(A) Boxplots of 50% integration times (ms) and (B) peak latencies (ms) of face-texture ERP differences for young (<30 years old) and old (>60 years old) adults. The median (across subjects) 50ITs and peak latencies along with confidence intervals are provided in the tables to the right of the subplots. For young subjects median 50IT and peak latencies for all conditions are given; for old subject, they are given for the two brightest conditions [condition 1 (c1) and 9 (c9)].

