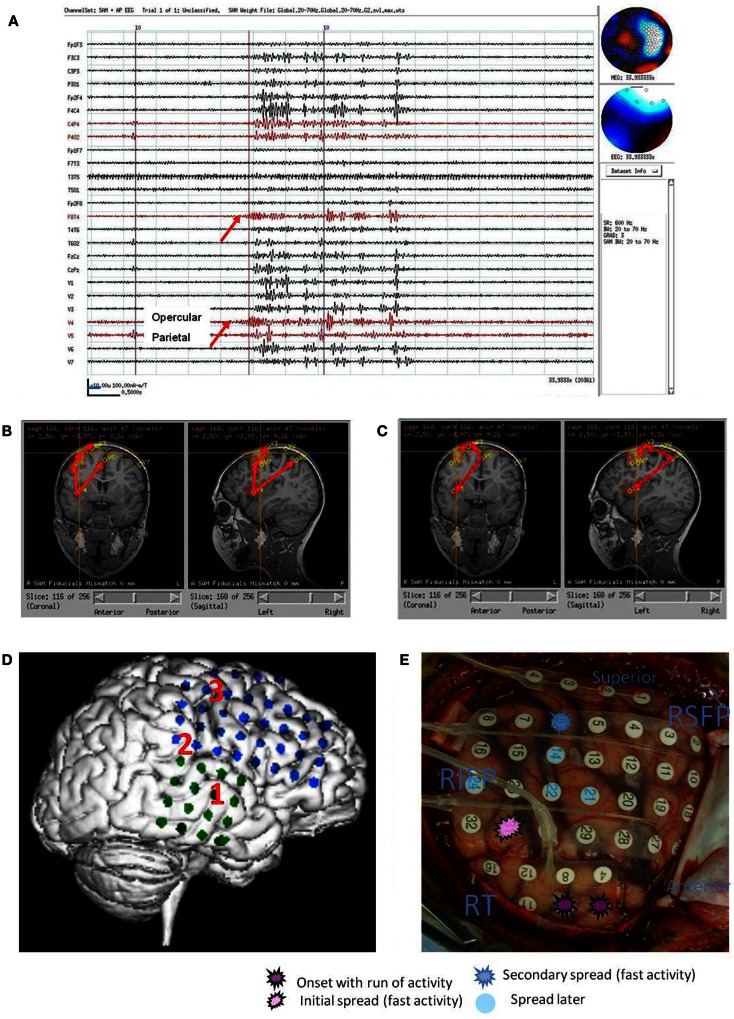
Figure 2.
Subject 2. (A) Bipolar AP EEG and seven virtual sensor channels showing onset of burst in unaveraged signals filtered in bandwidth 20–70 Hz, digitized at 600 Hz. Red arrow at V4, right operculum/insula, shows burst onset preceding first apparent onset in F8T4 EEG channel by 100 ms. For VS locations, onset in location V4 occurred first followed by right mesial parietal V5 (80 ms), then right mid frontal V7 (240 ms), and right superior mid frontal V3 and V1 (260 ms), and finally right posterior frontal V2 (300 ms). (B) Subject’s MRI scan showing one possible pattern of spread based on the timing of the VS peaks. (C) Subject’s MRI showing a second timing pattern that occurred in other bursts (not shown) with earliest onset in superior mesial parietal V5, then superior posterior frontal V3 and operculum/insula V4, and then lateral superior midfrontal V1. Red arrows indicate relative timing of peaks. (D) Subject’s 3D MRI scan and grid electrode locations. Red numbers 1–3 indicate the ictal onset (1) and spread pattern based on ECoG (2, 3). (E) Intraoperative photograph of brain and subdural grids with ictal onset right mid temporal (dark purple), spread to inferior parietal (pink), then superior posterior frontal (dark blue).

