Figure 5.
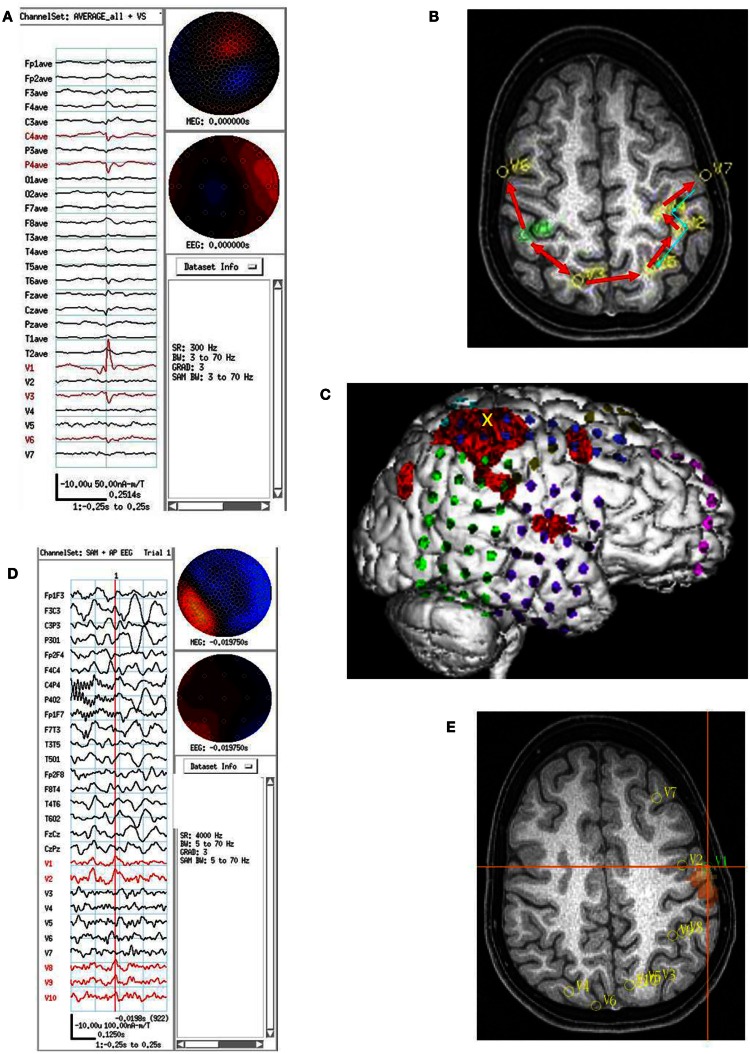
Subject 5. (A) EEG in average reference montage and seven virtual sensor channels showing average of 72 interictal spike epochs in bandwidth 3–70 Hz. For this averaged spike, epochs were aligned based on spike peak detected at VS location 1 in right parietal lobe in the 20–70 Hz bandwidth. The earliest onset occurred in V1 about 33 ms before the first onset in EEG channels C4 and P4. The panel also shows the first peak in V1 preceded the peak in V3 right mesial parietal and V6, right posterior frontal. Averages of epochs based on the timing of the spikes at each of the other six VS locations (not shown) were compared to obtain a composite of spike peak timing differences among all VS locations. (B) Subject’s MRI scan showing the composite of spike peak timing differences. Red arrows indicate relative timing of peaks. The average of epochs based on MEG spike detections in the 20–70 Hz bandwidth for VS location V7 showed an additional pattern of spike peak timing that tracked back from left posterior frontal to anterior parietal, then posterior parietal, but did not cross the midline to the right hemisphere. (C) 3D reconstruction of the subject’s MRI scan showing subdural electrode locations over right frontal, parietal, and temporal lobes. Ictal onset was in superior anterior parietal at the yellow X. [The red regions here represent region of activation from subtraction ictal SPECT co-registered with MRI (SISCOM) but were not analyzed as part of the current study.] (D) Combined EEG/MEG study performed 2 months postoperatively because subject continued to have seizures. Bipolar AP EEG and 10 virtual sensor channels showing average of 3 interictal spike epochs in bandwidth 5–70 Hz, digitized at 4 KHz. The peaks at VS locations 1–2 and 8–10 all seem to occur at approximately the same time. Spikes were seen in the MEG signals, but not well seen in the EEG. (E) The subject’s MRI scan showing the VS locations from the postoperative MEG. Highest excess kurtosis was at left posterior frontal near V1 and V2 (red region). This location was also near the location of the second spread pattern seen preoperatively (Panel B) in left posterior frontal (V7 location in that panel).

